The Finviz Stock Screener offers a powerful and user-friendly way to filter stocks using fundamental, technical, and descriptive data without a paid Finviz subscription.
Plan | Annual Subscription | Promotion |
|---|---|---|
Finviz Elite | $299.5 ($24.96 / month) | 30-day money-back guarantee |
Ideal for retail investors and long-term traders, the free screener enables screening across valuation metrics, performance data, volume, and insider activity using real-time-delayed market information.
How to Use Finviz Free Stock Screener
The Finviz free screener includes robust features that support both technical and fundamental analysis.
While it lacks real-time data and advanced customization, its preset filters still offer valuable market insights.
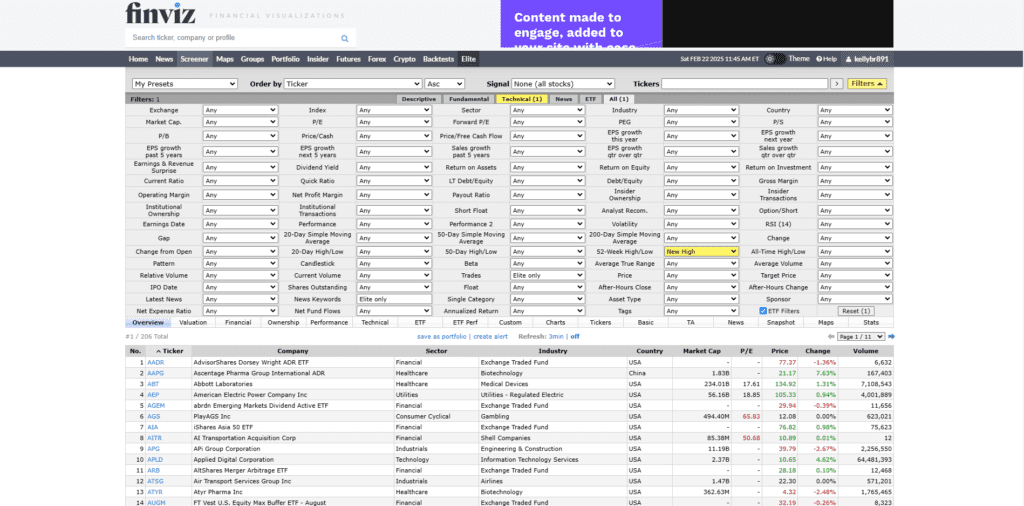
1. Technical Screening for Momentum and Breakouts
Finviz's screener includes several technical filters useful for spotting momentum-driven opportunities or stocks nearing breakout levels.
Moving Averages & Breakouts: Screen for stocks trading above the 50-day or 200-day SMA, or hitting new 52-week highs to identify breakout candidates.
Volume Spike: Filter for unusual volume to find stocks drawing increased attention.
RSI & MACD: Use preset RSI and MACD ranges to identify overbought or oversold conditions.
-
Example
A trader wants to identify momentum stocks hitting new highs. They set:
Signal: New High
Price: Over $10
Average Volume: Over 500K
This helps reveal stocks gaining attention and potentially entering strong uptrends.
2. Fundamental Filters for Value and Growth Investors
Finviz allows users to screen for stocks using valuation and growth metrics to identify either undervalued opportunities or high-growth plays.
P/E and P/B Ratios: Filter stocks trading below historical valuation benchmarks.
EPS Growth: Spot companies with strong historical and projected earnings growth.
Debt/Equity: Identify financially stable firms with low leverage.
-
Identify Stock By Fundamental Filters: Example
A value investor seeks solid fundamentals and low debt. They set:
P/E: Under 15
EPS Growth Next 5 Years: Positive
Debt/Equity: Under 0.5
This narrows down companies with stable financials and potential for long-term appreciation.
3. Sector and Industry Screening
Finviz enables stock filtering across both sector and industry levels, making it easier to perform targeted sector research or build a diversified portfolio.
Sector & Industry Filters: Choose from categories like Technology > Semiconductors or Healthcare > Drug Manufacturers.
Market Cap: Add size constraints (e.g., mid-cap, large-cap) for further focus.
Performance: Filter based on recent price performance within a sector.
-
Example
An investor tracking green energy selects:
Sector: Utilities
Industry: Renewable Energy
Performance (Week): Up
This quickly isolates industry segments gaining momentum or showing strong recent returns.
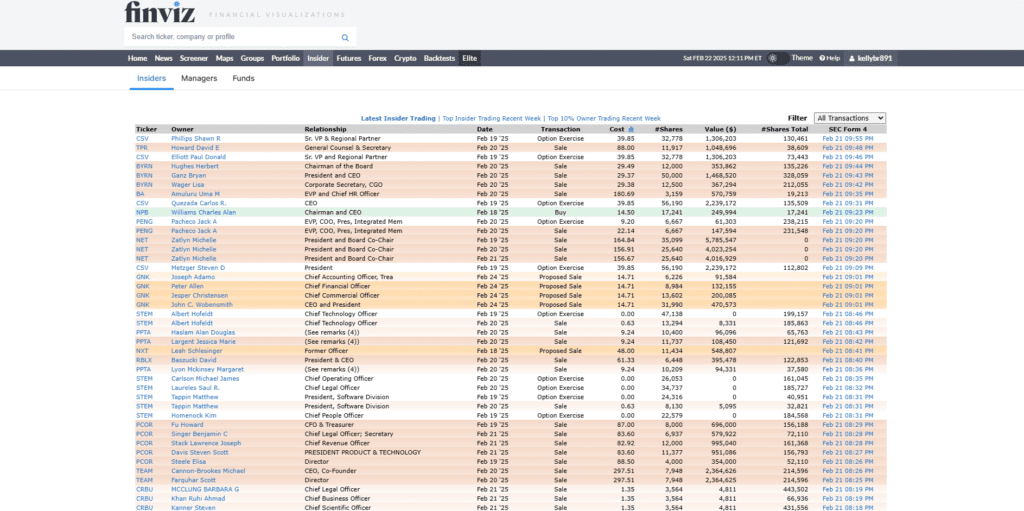
4. Insider Trading & Ownership Insights
One of Finviz’s standout free features is its insider trading data, helping users gauge insider sentiment.
Latest Insider Trades: View recent buying or selling by company executives.
Top 10% Owner Activity: Filter by high-level ownership changes.
Insider Signal: Spot bullish behavior from executives or major shareholders.
-
Example
An investor wants stocks with recent insider buying. They set:
Insider Transactions: Buy
Market Cap: Over $1B
This may help identify companies where internal leadership has high confidence in future performance.
Best Paid Finviz Elite Screener Features
Finviz Elite unlocks advanced screening tools tailored for active traders and investors seeking real-time data, detailed filters, and in-depth market research.
These premium features improve stock selection by enabling faster decision-making, historical data analysis, and more precise targeting across market segments.
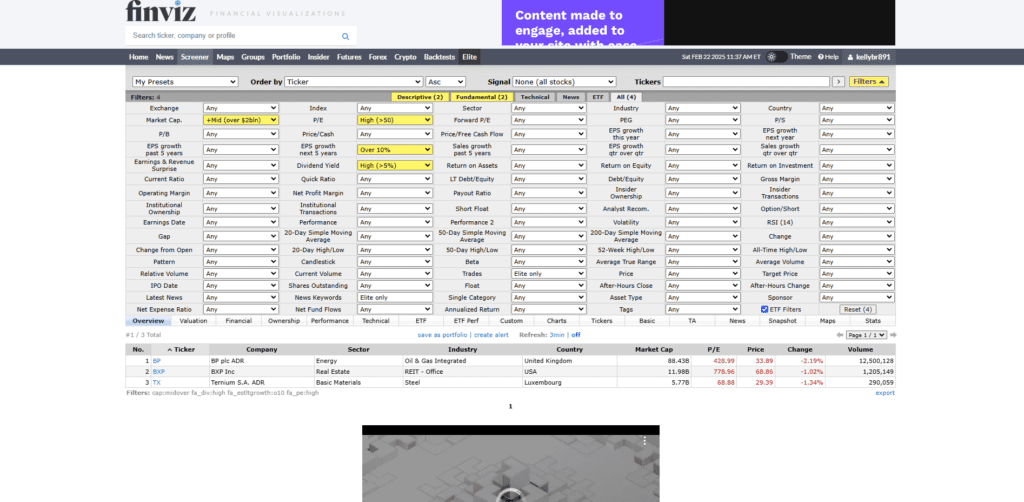
1. Real-Time & Custom Screener Filters
Finviz Elite allows users to create custom filters with real-time data, significantly enhancing the ability to monitor fast-moving stocks or time-sensitive strategies.
Real-Time Updates: Screen and react to market data instantly, including intraday price moves, volume changes, and news sentiment.
Custom Numeric Ranges: Set specific valuation or technical ranges (e.g., P/E between 15.5–18.2) instead of using preset values.
Advanced Data Filters: Combine descriptive, fundamental, and technical metrics to generate strategy-specific stock ideas.
-
Example
A trader wants to find undervalued mid-cap stocks showing early momentum. They set:
Market Cap: $2B–$10B
P/E: 10–18
Price: Above 50-day SMA
This filter returns real-time opportunities for swing trades or value entries with bullish price signals.
2. Insider Activity and Hedge Fund Screening
Finviz Elite offers real-time tracking of insider trades and ownership shifts—ideal for aligning with “smart money” behavior.
Live Insider Trades: Monitor purchases or sales by executives, directors, and 10%+ owners.
Top 10% Ownership Trends: Track stocks where insiders or institutions have significant recent positions.
Ownership Change Filters: Spot firms recently targeted by hedge funds or institutional buyers.
-
Example: Identify Stock By Insider Activity
An investor looks for stocks with high insider conviction. They filter for:
Insider Transactions: Real-time buys
Institutional Ownership: Over 70%
Sector: Technology
This returns tech stocks with insider and institutional alignment—potential indicators of confidence in future performance.
3. Technical Pattern Filters & Alerts
Finviz Elite supports advanced technical filtering and real-time alerts based on pattern recognition and indicator setups.
Technical Patterns: Scan for breakouts, consolidations, candlestick formations, and moving average crossovers.
Custom Alerts: Set email alerts for price breakouts, RSI thresholds, or volume surges.
Intraday Monitoring: Use real-time technical signals across multiple timeframes for faster trade setups.
-
Identify Stock By Technical Pattern: Example
A swing trader monitors breakout stocks. They screen for:
Signal: Channel Up
RSI: Below 60
Volume: 2x Average
The screener identifies breakout candidates on strong volume—valuable for short-term trade setups.
4. Data Export and Historical Financial Charts
Finviz Elite allows users to export results and review financial data across up to 8 years—ideal for fundamental analysis and offline research.
Data Downloads: Export screening results to Excel or CSV for further analysis or backtesting.
Historical Financial Charts: Visualize trends in EPS, revenue, and margin data over multi-year periods.
Volatility & Beta Metrics: Evaluate risk profiles based on price variability and market sensitivity.
-
Example
A long-term investor researches high-growth tech stocks. They set:
EPS Growth Past 5 Years: Over 15%
Revenue Growth: Positive
Export results for detailed offline analysis
This process supports strategy development around sustainable earnings momentum.
FAQ
Yes, as one of the top free screeners, Finviz Free allows saving up to 50 screeners. However, the number of stocks displayed per view is limited, and saved screens use delayed data.
No, Finviz does not have a mobile app. But its website is mobile-friendly and can be accessed through any smartphone browser for on-the-go screening.
Finviz primarily focuses on U.S.-listed stocks. While some foreign ADRs may appear, the screener does not fully support international stock markets.
Finviz includes upcoming earnings dates and historical EPS trends in its stock profiles. Elite users can also screen by earnings date or growth metrics.
Yes, both free and Elite users can view ETF data, but only Elite subscribers get access to advanced ETF filters, such as fund flows and sector exposures.
No, Finviz does not support cryptocurrency screening. It is focused on stocks, ETFs, forex, and futures, so crypto traders should use other platforms.
Finviz does not offer mutual fund screening. Its screener is built for equities, ETFs, and forex, so mutual fund analysis must be done elsewhere.
