Table Of Content
What Is a MACD Stock Screener?
A MACD stock screener is a technical analysis tool that helps traders identify stocks with bullish or bearish momentum based on Moving Average Convergence Divergence (MACD) signals.
Instead of evaluating company fundamentals, this screener focuses on price trends and crossovers to pinpoint short-term opportunities. It’s often used by swing traders and momentum investors to find entry or exit points aligned with price strength or weakness.
MACD screeners allow you to filter stocks by common signals — such as MACD line crossing above the signal line, MACD turning positive, or histogram reversals — making it easier to spot trades supported by technical momentum.
How a MACD Stock Screener Helps Investors
Unlike fundamental screeners, a MACD screener zeroes in on market sentiment and price action, giving you an edge in timing trades or managing short-term risk.
Spot Bullish Crossovers: MACD line crossing above the signal line can indicate the start of a bullish move. Traders often use this signal to enter positions early in an uptrend.
Identify Momentum Shifts: MACD turning from negative to positive territory shows growing strength. Combining this with rising volume can confirm trend reversals.
Catch Overextended Pullbacks: When MACD begins to flatten or reverse after a sharp move, it may indicate consolidation or a potential reversal — useful for counter-trend setups.
Confirm Breakouts or Breakdowns: Use MACD divergence (e.g., lower MACD highs vs. higher price highs) to spot weakening momentum before a reversal.
These tools support more agile, technical strategies compared to slow-moving, value-based screeners.
Mastering the MACD Screener: Key Strategies
MACD is a widely used technical indicator, but how you apply it in your screener makes all the difference.
Here are essential strategies from our experience to tailor the screener to your trading style.
-
Align With Your Trading Objective
Before building your MACD screen, clarify your trading approach. Are you a swing trader looking for quick moves or a trend follower aiming to ride momentum?
Matching the MACD setup to your objective increases relevance and reduces false signals.
Examples of goal-based filters:
Swing traders might screen for MACD bullish crossover in the last 1–3 days, paired with high relative volume.
Trend followers could filter for MACD above signal line and zero, plus price above 50-day moving average to catch early trend continuation.
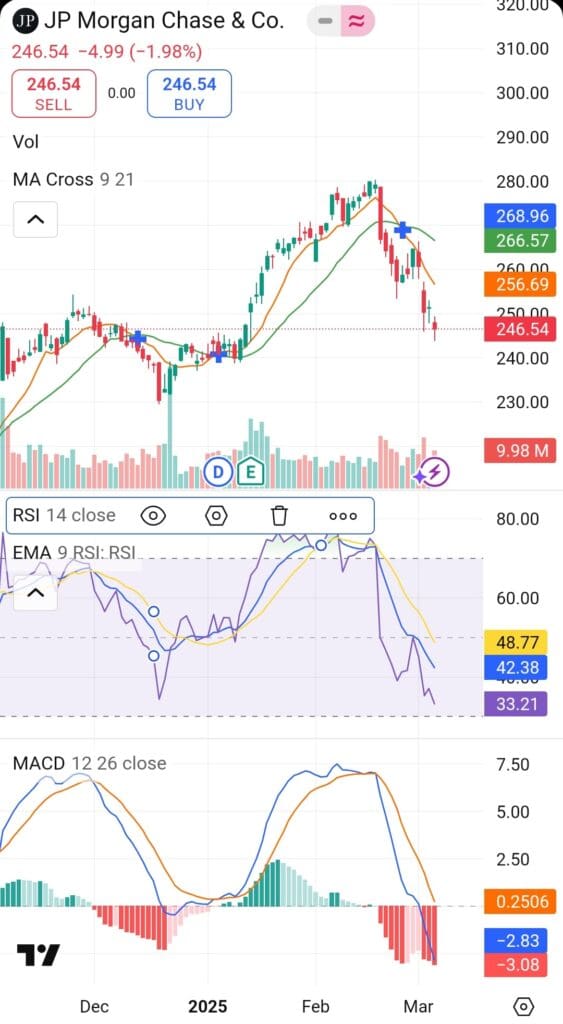
Reversal traders may search for MACD divergence combined with oversold RSI to anticipate snapbacks.
Knowing your setup ensures that your screen delivers actionable results—not noise.
-
Scan Frequently—But Stick to Key Timeframes
MACD signals change with market conditions. Unlike fundamental screeners, MACD-based tools require more frequent scans—but still benefit from structure.
When to use your screener:
Daily (End-of-Day): Most MACD signals are best used on the daily chart for swing trades.
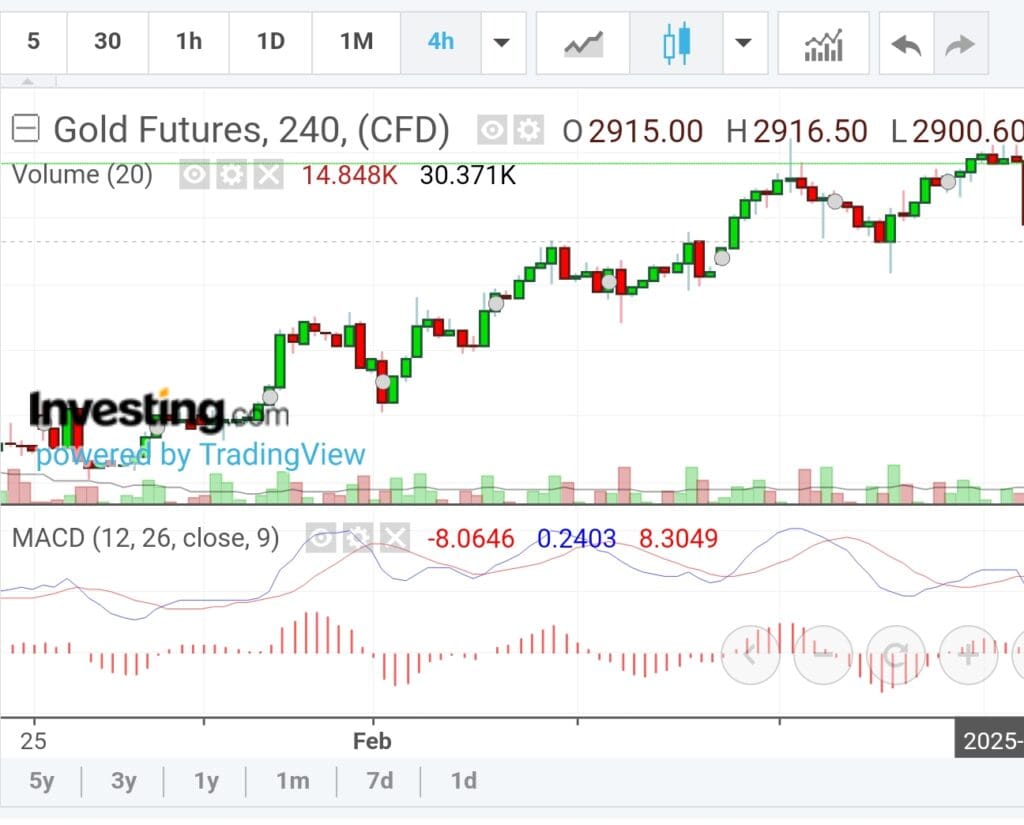
Intraday (on select platforms): For active traders, platforms like TradingView or Finviz Elite allow 1-hour or 4-hour chart filtering.
Weekly review: Look for longer-term MACD crossovers for position trading or portfolio rebalancing.
Scanning regularly keeps your watchlist fresh without overtrading or reacting to every fluctuation.
-
Combine MACD With Other Technical Filters
MACD is powerful, but combining it with other indicators improves reliability and helps filter out false signals.
Key combinations to try:
MACD crossover + RSI between 50–70: Confirms momentum without being overbought.
MACD histogram rising + bullish candlestick pattern: Adds price action confirmation.
MACD + Volume Spike: Reinforces conviction that a trend is gaining strength.
MACD crossover + Breakout from Consolidation: Identifies strong entries on breakouts backed by momentum.
These combos help you screen for higher-probability setups and avoid chasing unstable price moves.

-
Track Results and Refine Over Time
Like any strategy, your MACD screeners should evolve. Keep track of trades that worked, signals that failed, and what market context they occurred in.
Tips for refining your process:
Save different screen setups based on market conditions (bullish trend, choppy, reversal).
Use charting tools like TradingView watchlists or TrendSpider to log past signals.
Adjust MACD parameters (e.g., 8/17/9 instead of 12/26/9) for faster or slower signals depending on your timeframe.
This feedback loop turns MACD screening into a data-backed strategy, not just guesswork.
Additional MACD Screener Features to Leverage
Some platforms offer extra tools that improve how you interpret MACD signals or combine them with broader technical indicators.
Timeframe Flexibility: Tools like StockCharts allow you to scan MACD on different timeframes (daily, weekly, intraday) simultaneously.
Backtesting Support: Platforms like Finviz Elite or Trading View offer simulated backtests so you can see how MACD signals performed historically.
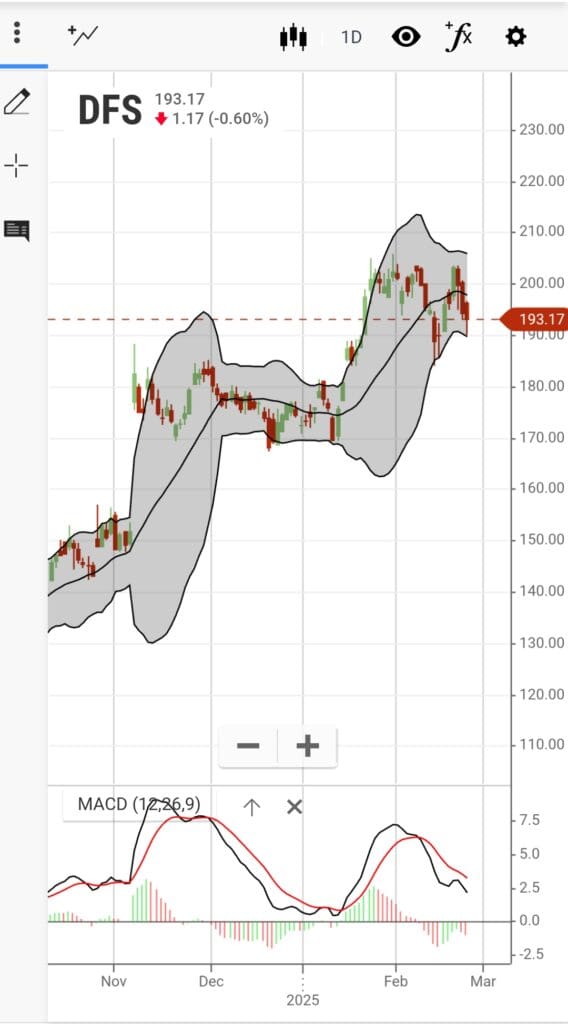
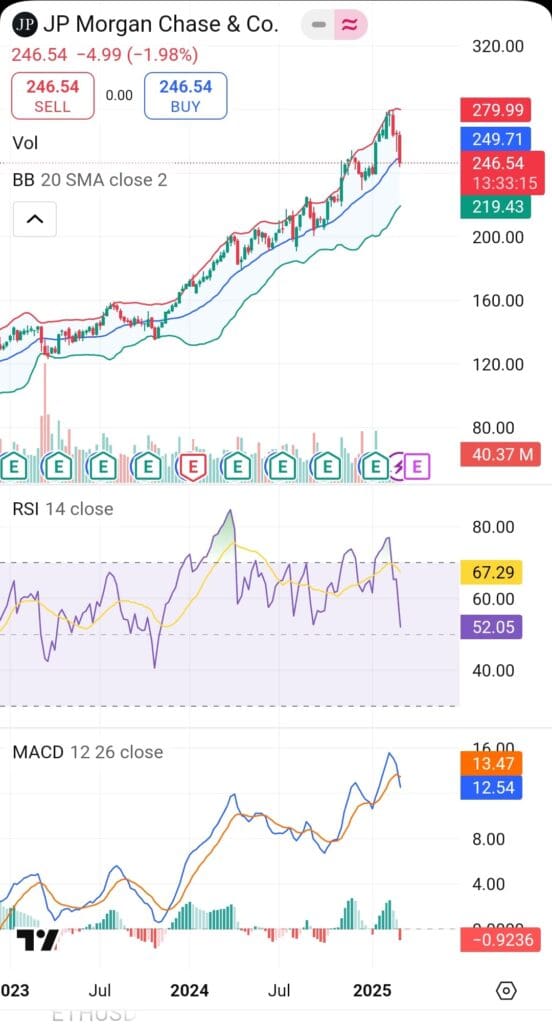
Combined Technical Screens: Use screeners that allow combining MACD with Bollinger Bands, Fibonacci levels, or breakout patterns to refine entries.
These advanced tools let you make smarter, faster decisions—especially in fast-moving markets.
MACD Stock Screeners Worth Exploring
While many platforms offer MACD-based screening, some go further with advanced technical filters, custom indicators, or AI-assisted scanning.
Depending on your trading style, these may offer more tailored functionality:
TradingView: Offers customizable MACD scripts, multi-timeframe analysis, and community-built strategies.
Finviz Elite: Great for quick MACD scans with volume, RSI, and chart pattern integration. Fast and intuitive interface.
StockCharts.com: Offers SharpCharts and ACP tools to combine MACD with other custom indicators.
TC2000: Real-time scanning with advanced charting and alert systems for serious technical traders.
Each offers unique advantages depending on how in-depth you want to go with MACD and beyond.
Plan | Subscription | Best For |
|---|---|---|
TradingView Premium | $59.95
$432 ($23.98 / month) if paid annually | Technical Analysts |
Benzinga Pro | $37
$367 ($30.58 / month) if paid annually | News-Driven Traders |
MarketBeat All Access | $39.99
$399 ($33.25 / month) if paid annually | Portfolio Trackers |
GuruFocus Premium | $499 ($41.58/ month)
No monthly plan, price for US citizens, price change by region | Guru Investors Portfolios |
StockTwits Edge | $22.95
$229.50 ($19.10 / month) if paid annually
| Social Sentiment Traders |
Finviz Elite | $39.50
$299.5 ($24.96 / month) if paid annually | Chart Pattern & Backtesting |
