Table Of Content
What Is Stock Volume and How Is It Measured?
Stock volume refers to the total number of shares traded in a specific security during a given time frame—typically daily. It includes both buy and sell orders and helps gauge market activity and investor interest.
Volume is measured by tracking every transaction on exchanges like the NYSE or NASDAQ. It resets at the start of each trading day and accumulates as trades occur.
You can easily find volume data on financial platforms like Yahoo Finance or investing.com.
-
How Volume Works?
Here’s what you need to know:
Trade Activity Count: Each completed transaction (regardless of size) contributes to volume.
Volume Bars: On stock charts, vertical bars display volume below price candles, helping visualize daily activity.
Not All Volume Is Equal: A high volume caused by institutional trades may signal different implications than high volume from retail traders.
As a result, volume helps confirm price trends and identify reversals when paired with other technical indicators.
Event Type | Trigger Example | Typical Impact on Volume |
|---|---|---|
Company-specific | Earnings report, product launch | High – often doubles or triples normal |
Market-wide | Fed interest rate announcement | Broad increase across many stocks |
Analyst actions | Major upgrade/downgrade | Moderate to high |
Social media activity | Trending on Reddit, Twitter (e.g., GME) | Extremely high |
Volume Parameters To Consider
Volume interpretation is essential for understanding momentum and liquidity. High trading volume often signals strong interest, while low volume can indicate uncertainty or lack of conviction.
High Volume: Suggests conviction. For example, if a stock breaks out of a resistance level with high volume, the move is likely more reliable.
Low Volume: Indicates weakness or lack of participation. A stock rising on low volume may reverse quickly.
Average Daily Trading Volume (ADTV): The average number of shares traded per day over a set period—often 30 or 90 days. This helps smooth out spikes and provides a benchmark.
Unusual Volume: Spikes above average volume without news may hint at insider moves or institutional accumulation.
What Investors Can Learn by Volume
Stock volume can reveal valuable insights about a security’s liquidity, momentum, conviction, and market sentiment—all of which help investors make more informed decisions.
While price tells you what is happening, volume often shows you how strong that move really is.
-
Validate Price Movements
When a stock’s price increases alongside high trading volume, it usually indicates strong conviction among investors. This means that many market participants are actively buying, reinforcing the trend.
On the other hand, a similar price move with low volume might be less reliable, as it could reflect limited interest or weak momentum.
Therefore, investors often look for volume confirmation to judge whether a price breakout or breakdown is sustainable or simply a short-term fluctuation likely to reverse.
-
Spot Early Interest
A sudden spike in trading volume—especially when there’s no immediate news—can indicate that large investors or institutions are quietly building positions ahead of a potential catalyst.
This type of volume behavior often occurs before earnings releases, mergers, or product launches.
While retail investors may not have early access to information, spotting unusual volume can serve as an early signal that something significant is about to happen.
As a result, it helps investors prepare for possible price volatility.
-
Understand Liquidity
Stocks that consistently trade at high volume tend to offer better liquidity, which means investors can enter or exit positions more easily without dramatically impacting the stock price.
This is especially important for active traders or those placing large orders. High liquidity also results in tighter bid-ask spreads, lowering transaction costs and reducing the risk of slippage.
Therefore, analyzing volume can help investors avoid illiquid stocks that may be harder to trade efficiently, especially during volatile market conditions.
-
Identify Turning Points
A surge in volume after a long downtrend can be an early sign of a trend reversal. This usually indicates that buyers are stepping in aggressively, often causing a shift in market sentiment.
For example, a stock forming a double bottom or bullish candlestick pattern with unusually high volume might be signaling that selling pressure is fading and accumulation is beginning.
Watching for volume spikes during key technical patterns helps investors identify more reliable entry points for potential rebounds.
How to Spot Volume by Charts or Indicators
Spotting volume through charts and indicators is one of the most practical ways investors confirm market strength, trend reliability, or reversals.
Most trading platforms—like TradingView or Yahoo Finance—make volume analysis accessible through built-in tools. Here's how to identify and interpret volume visually:
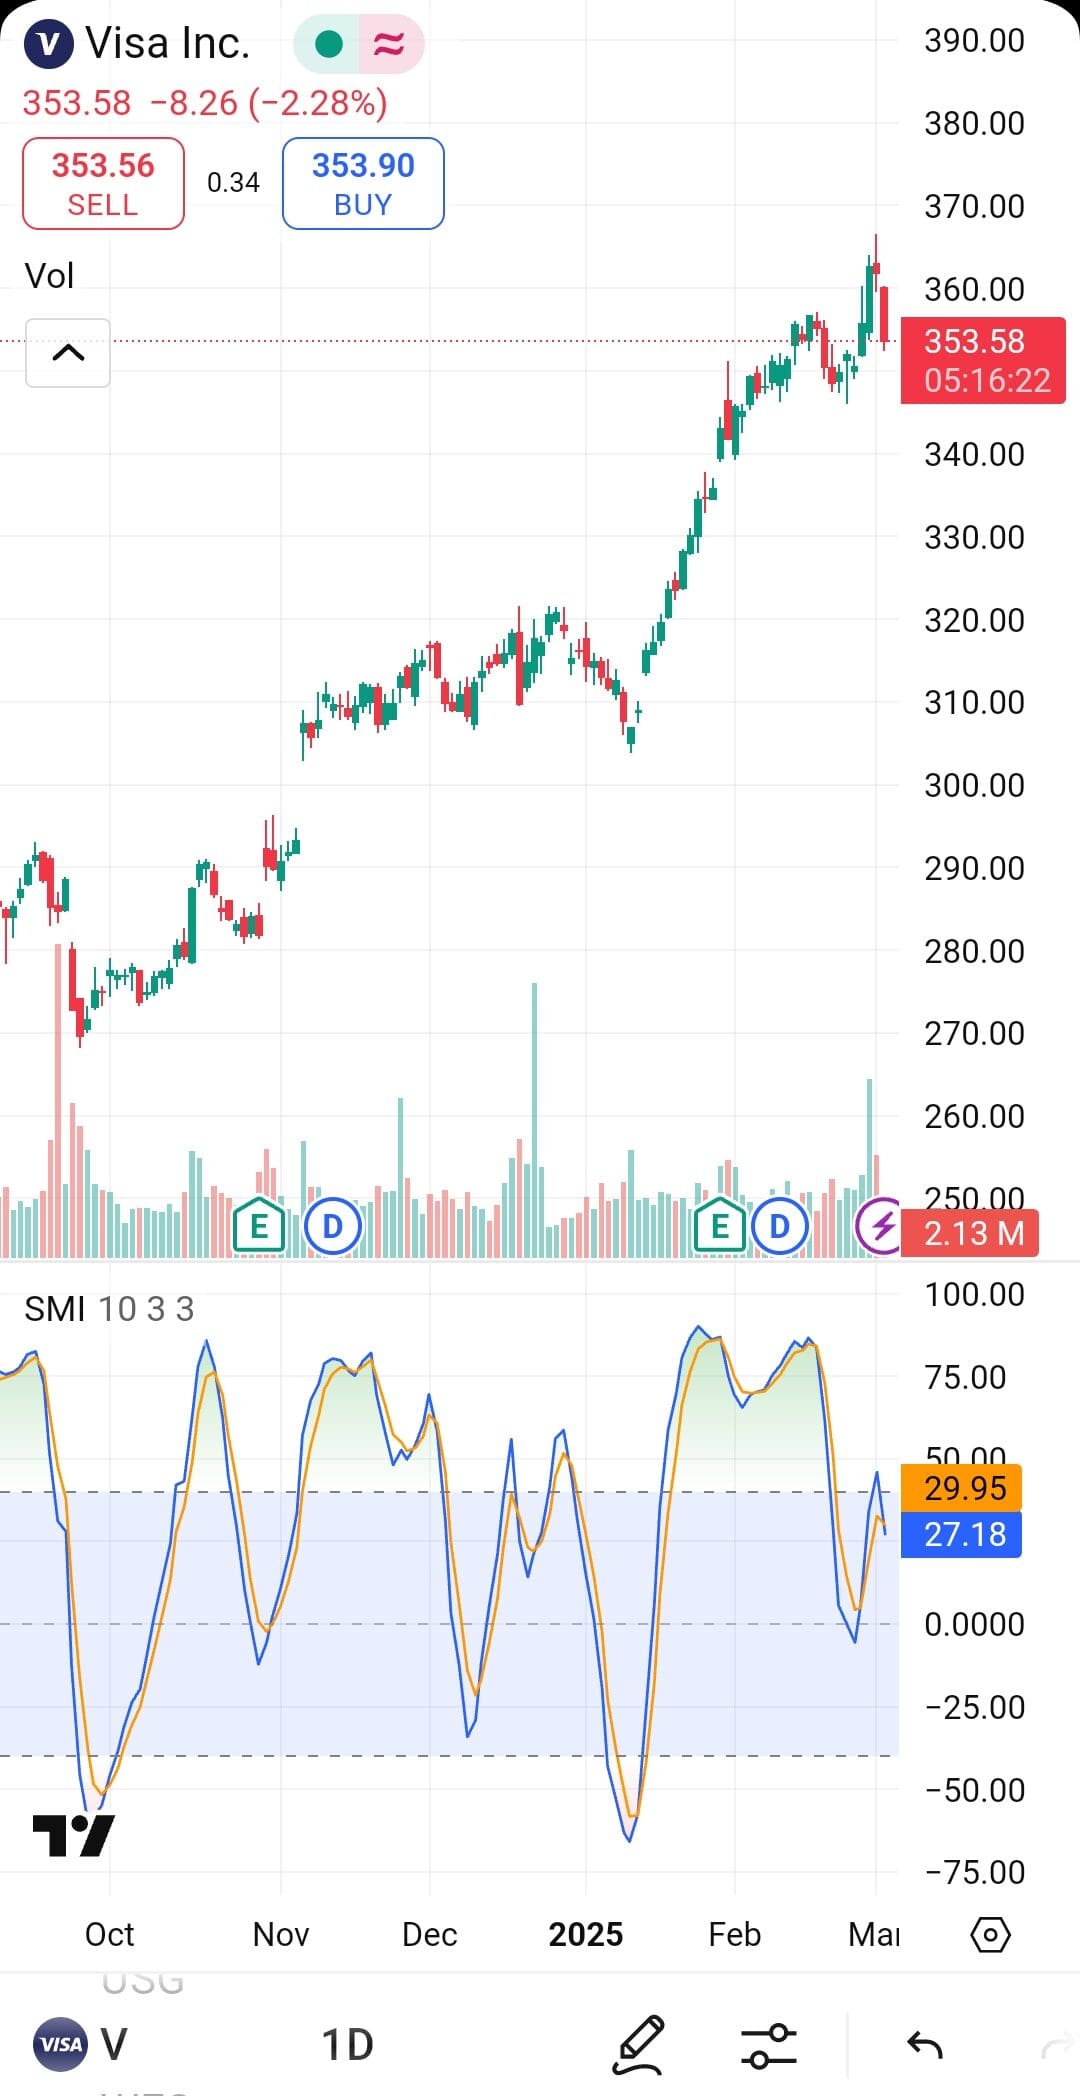
1. Volume Bars on Price Charts
Most price charts display vertical bars at the bottom, showing trading volume for each time period (day, hour, etc.).
Taller bars indicate higher trading activity.
Use this to compare current volume to previous days and spot volume spikes.
For example, if a stock breaks resistance and volume bar doubles its 20-day average, it adds credibility to the move.
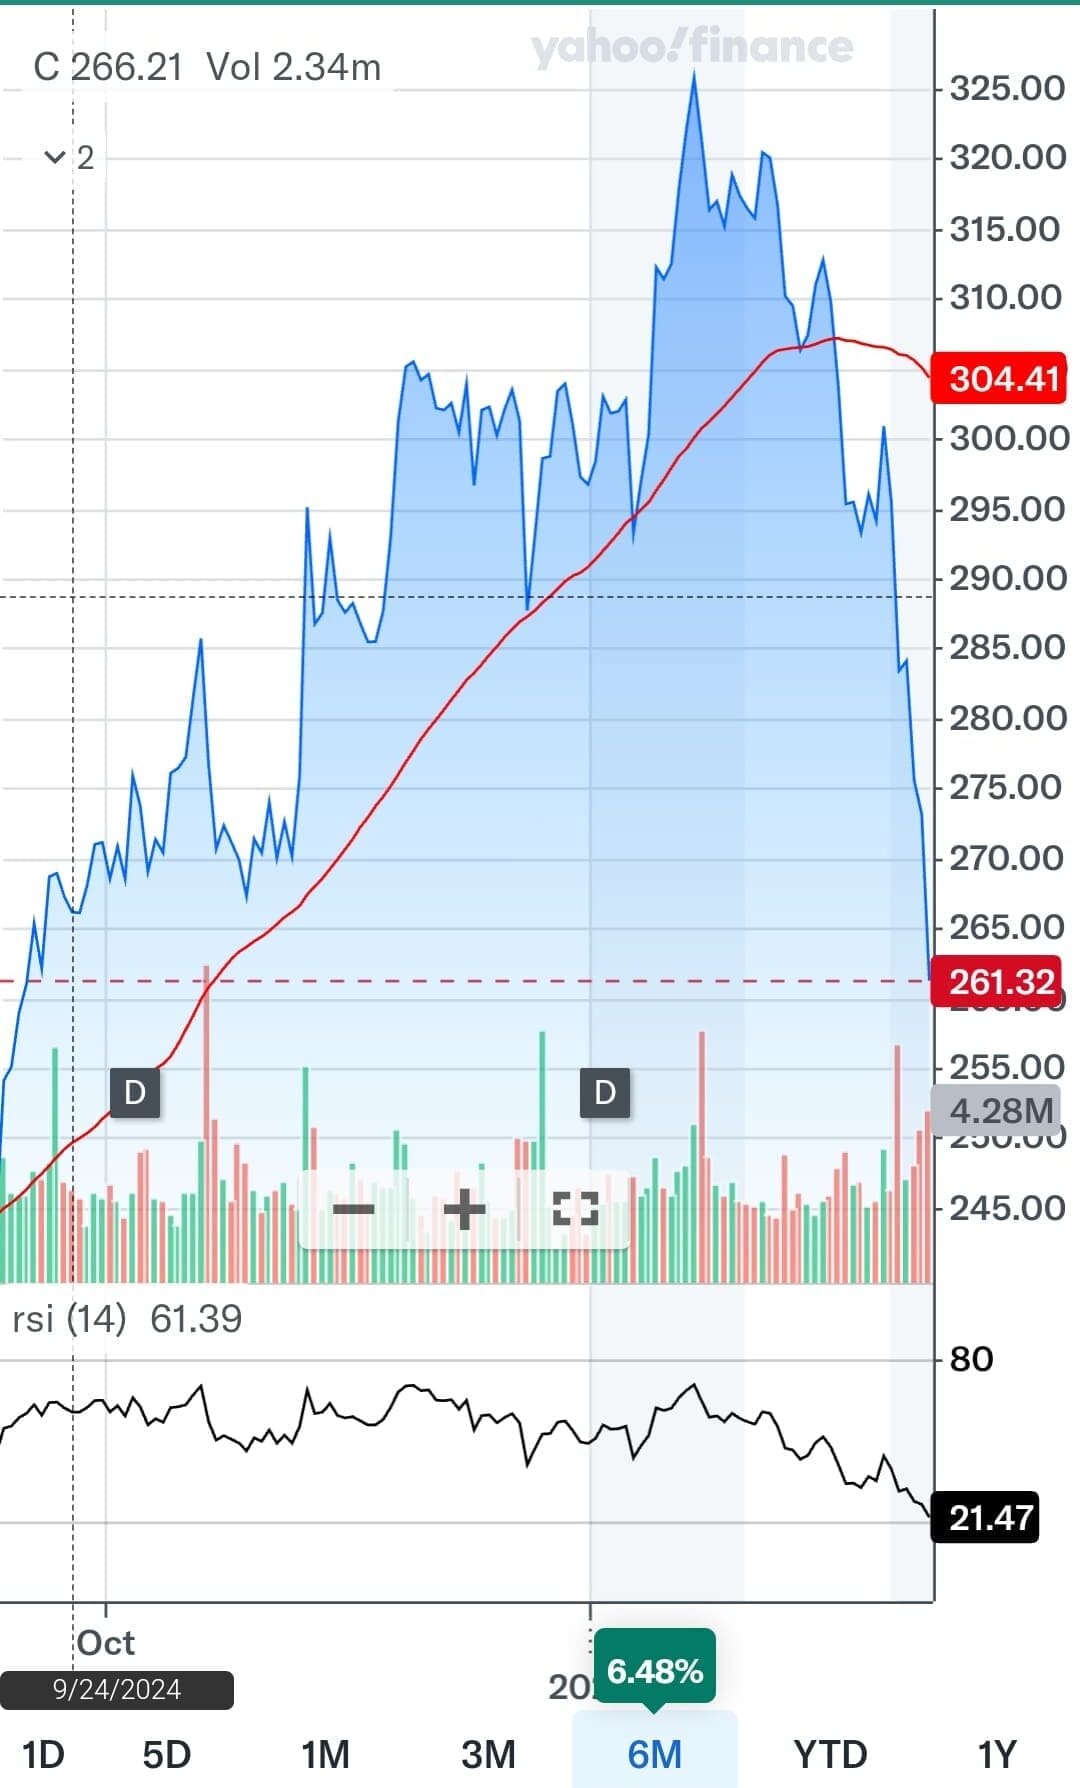
2. On-Balance Volume (OBV)
OBV is a momentum indicator that adds volume on up days and subtracts it on down days.
Rising OBV means accumulation (buying pressure).
Falling OBV suggests distribution (selling pressure).
If OBV rises while price stays flat, it may hint at an upcoming breakout.
3. Volume Moving Average
Overlaying a moving average (e.g., 20-day volume MA) helps you compare current volume against typical levels.
When volume exceeds the average, it may signal a shift in sentiment.
A breakout with volume far above the MA is often more trustworthy than one with low participation.
4. Volume Oscillator
This tool compares short-term and long-term volume averages to measure volume momentum.
A positive oscillator shows increasing buying interest.
A negative oscillator indicates declining volume and weaker trends.
It’s useful to spot when a trend is losing strength even before the price reacts.
What Impacts Stock Volume?
Several factors influence stock volume because traders respond to market conditions, news, and sentiment changes throughout the day.
Earnings Reports & News: Company announcements can spark major interest. For example, positive quarterly results often trigger higher volume due to increased buying activity.
Market Sentiment & Trends: A bullish or bearish trend across the broader market can lift volume across many stocks, especially in key sectors like tech or energy.
Economic Data Releases: Macroeconomic news—such as inflation reports or jobs data—can drive volume spikes as investors reposition their portfolios.
Analyst Upgrades/Downgrades: A major upgrade by a firm like Goldman Sachs may lead to higher volume as traders react.
Meme Stock or Social Media Hype: Volume can explode when stocks trend on platforms like Reddit or Twitter, as seen with GameStop and AMC.
FAQ
Zero volume means no shares were traded during the time period being measured. This can happen with very illiquid stocks or outside regular market hours.
Yes, volume can sometimes be manipulated through tactics like wash trading, where shares are bought and sold simultaneously to create artificial activity. Regulators monitor for these behaviors, but it can still occur, especially in low-volume stocks
Not necessarily. While high volume may signal interest or momentum, it can also indicate panic selling or volatility driven by uncertainty.
Yes, volume is typically much lower after hours due to fewer participants and limited liquidity. This can lead to wider spreads and more volatile price moves.
Penny stocks tend to be less followed and less trusted by institutional investors, resulting in fewer trades. Their low volume can make prices more volatile and harder to execute large orders.
Stocks with higher volume usually have tighter bid-ask spreads because there's more competition among buyers and sellers. Low-volume stocks often have wider spreads, increasing trading costs.
Volume measures trading activity, while volatility refers to price movement. A stock can be volatile with low volume or stable with high volume—it depends on the market context.
Yes, ETFs also have volume, which measures how many shares are traded. However, their liquidity is also influenced by the liquidity of the underlying assets they track.
Short-term traders often rely heavily on volume to time entries and exits, while long-term investors may use it to confirm broader trends or detect institutional interest.