Stock Rover Premium
Monthly Subscription
Promotion
Our Rating
Best For
- Overview
- Features
- Pros & Cons
Stock Rover’s Premium plan is a powerful stock analysis and portfolio management platform designed for investors who rely on fundamental data, financial screening, and in-depth stock research.
It offers over 375 financial metrics, 10 years of historical data, and advanced portfolio tracking tools that help users make informed investment decisions.
The stock screener is one of the best in the market, allowing investors to filter stocks and ETFs based on valuation, growth, and dividend metrics.
Features like future dividend income projections, Monte Carlo simulations, and correlation analysis help investors manage risk and optimize portfolios.
However, Stock Rover Premium is not perfect. It lacks real-time stock prices, advanced technical analysis tools, and direct trading capabilities, making it less useful for day traders or high-frequency traders.
- Portfolio tracking & analysis
- Stock screener customization
- Monte Carlo simulations
- Trade evaluator insights
- Correlation analysis
- Portfolio rebalancing
- ETF & mutual fund research
- Customizable watchlists
- Alerts & notifications
- Brokerage account integration
- Advanced comparison tools
- 10 years financial data
- Extensive fundamental metrics
- Advanced portfolio tracking
- Powerful stock screener
- 10-year financial history
- Monte Carlo simulations
- No real-time stock prices
- Limited technical analysis
- No stock ratings included
- Overwhelming UI for beginners
- Lacks direct trading options
How To Research Stocks & Manage Portfolio
Portfolio analytics, risk management, and trade insights make Stock Rover ideal for investors. Here’s how it helps analyze stocks and manage your portfolio:
-
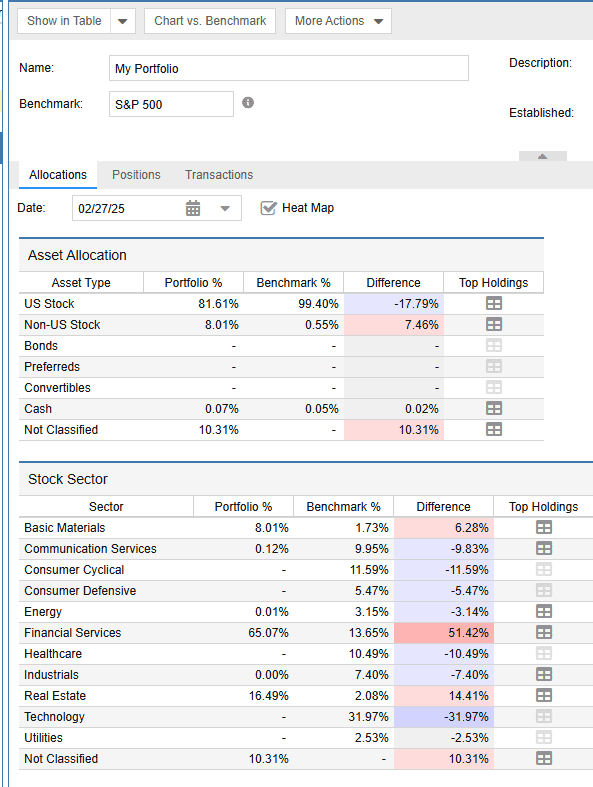
Portfolio Tracking & Analysis
Managing a portfolio isn’t just about tracking stock prices, it’s about seeing the bigger picture.
With Stock Rover Premium, we synced a brokerage account and immediately got access to detailed performance tracking, allocation chart, risk metrics, and portfolio analytics.
We especially liked the following features:
-
General Analysis
Stock Rover’s Analytics feature provides deep insights into portfolio performance, helping investors understand how well their strategies are working.
When we tested it, we could instantly see detailed risk assessment tools, return breakdowns, and asset allocation reports.

-
Correlation Analysis
Diversification is key to managing risk, and Stock Rover’s Correlation Analysis tool helps ensure that your investments aren’t too closely linked.
When we tested it, we ran an analysis on a portfolio containing tech stocks, blue-chip dividend stocks, and ETFs. The tool revealed that some holdings had a high correlation, meaning they moved together, increasing risk.
For investors, this tool is useful for finding truly diversified investments.

-
Portfolio Rebalancing and Trade Planning
Stock Rover’s Portfolio Rebalancing and Trade Planning feature makes this easy by showing when your portfolio drifts from its target allocation.
We tested it by setting up an ideal asset allocation (60% stocks, 30% bonds, 10% cash) and running a rebalancing check.
The tool immediately identified that our stock holdings had grown beyond the target and suggested trades to realign the portfolio.
-
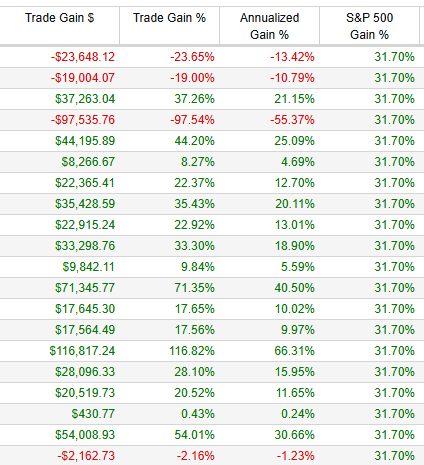
The Trade Evaluator – Learn from Your Wins and Losses
Stock Rover’s Trade Evaluator helps traders see which trades were good and which were costly.
Instead of just showing gains and losses, it evaluates if a trade was actually a smart decision relative to the market.
It helps answer questions like: Did my entry and exit timing add value? Was my trade a good decision compared to the S&P 500? Should I have held longer?
-
Monte Carlo Portfolio Simulation
Monte Carlo simulations let you stress test your portfolio under different market conditions, which is incredibly useful for retirement planning or assessing long-term growth.
The tool generates thousands of potential market scenarios based on historical performance and volatility, giving probabilities of different outcomes.
For instance, we saw that a tech-heavy portfolio had a high upside but also greater downside risk.
-
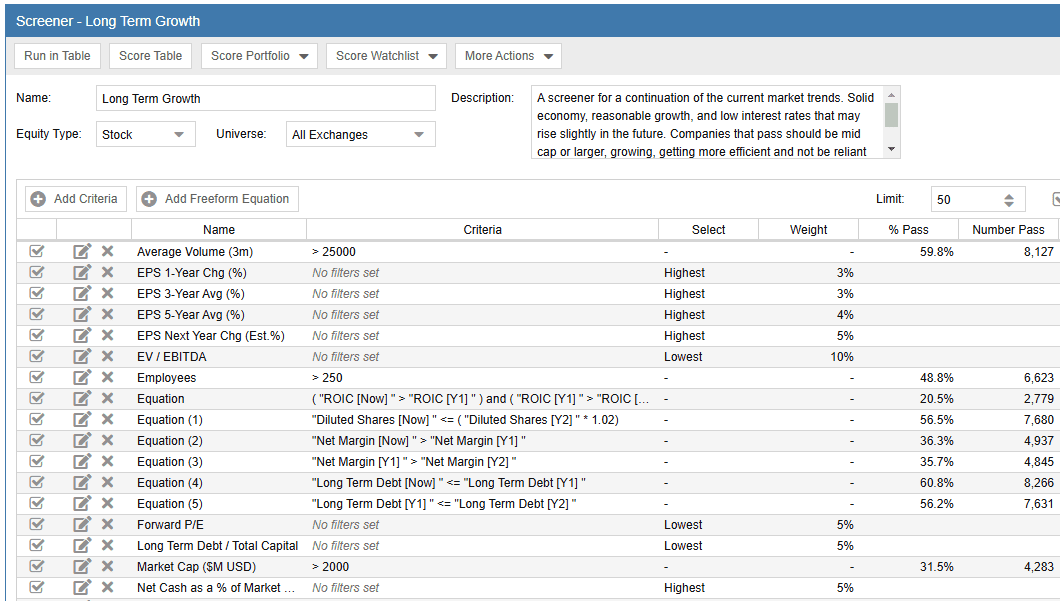
Screeners
The screener options in Stock Rover provide a highly customizable way to filter and analyze stocks based on specific financial metrics and investment strategies.
We tested it by setting up screens for high-dividend stocks, undervalued growth stocks, and ETF performance comparisons—and the results were fast and detailed.
You can tweak the screener settings to match your personal investment style, whether that’s value investing, growth, or income-focused strategies.
While incredibly detailed, it’s not as beginner-friendly as some other screeners. Here are the things you should know before starting:
-
Navigation Panel
At the top left (on desktop view), the navigation panel offers different ways to view and analyze stocks.
You can switch between a table view, which presents data in a spreadsheet format, a chart view for visual analysis, and an insight view that provides more in-depth information.
The “All” view consolidates multiple perspectives, making it useful when you need a broader overview of the financial data.
-
Screeners
Below that, the screeners section contains a list of pre-built stock screeners that help investors identify stocks that meet certain criteria.
Options like breakout screener, dividend growth, safe performers, and strong buys allow users to filter stocks based on their investment strategy, whether they are looking for high-growth companies, stable dividend payers, or undervalued opportunities.

-
Screener Actions
Further down, the screener sctions panel provides tools to customize and refine stock screening. You can modify existing screeners, create new ones from scratch, or manage and import custom screeners.
Other options, like chart screener and filter current table, allow for more dynamic data analysis, while the snapshot screener results function helps capture and store screening results for later reference.

-
Views
On the right side, the views allows users to dive deeper into specific financial metrics.
Organized into different categories like analysts, dividends, ETF & Fund, performance, ratings, technicals, and valuation, this section enables users to analyze stocks based on key financial data points.
For example, under the Analysts category, users can explore analyst estimates, ratings, and revisions.

-
Stock Analysis
Stock Rover’s stock analysis provides in-depth stock analysis with a wealth of data points for over 8,500 North American stocks.
When analyzing a stock, the summary section gives a quick overview of the company, helping users understand its core business operations.

For deeper analysis, the Technicals section covers indicators like RSI and moving averages. Dividend investors can examine Dividends, while the Financial Health section reviews debt levels and cash flow.
Scores and valuation Estimates provide an objective measure of the stock’s intrinsic value, while growth metrics highlight revenue, earnings, and profitability trends.

The returns vs. benchmarks section allows investors to compare stock performance against key indices like the S&P 500.
Users can also compare ratings vs. peers, see competitors, and track top funds holding the stock. Finally, Consensus Estimates summarize analyst opinions, while integrated news sources like Benzinga News and Yahoo News provide real-time updates.
Stock Rover’s Premium: Features For Smart Investing
From ETF research to alerts, Stock Rover’s extra features offer serious value. Here’s what stands out:
-
ETFs & Mutual Funds Research
Stock Rover provides comprehensive ETF and mutual fund research, allowing investors to compare and analyze thousands of funds based on performance, holdings, and valuation metrics.
We tested this feature by pulling up data on major ETFs, including fund expense ratios, sector allocations, and historical performance.

One of the standout tools is the ETF & Fund Comparison, which lets users evaluate multiple funds side by side.
Investors can see which funds have outperformed the market, identify sector-heavy funds, and analyze fund flows to understand market trends.
-
Alerts – Stay Ahead of Market Movements
Stock Rover’s Alerts feature allows investors to set real-time notifications for stock price changes, earnings updates, valuation shifts, and technical indicators.
When we tested it, we set up alerts for price drops on potential buy targets, earnings announcements for our holdings, and RSI movements for trend analysis.
The alerts were delivered instantly via email and text, ensuring we never missed a key market event.
One of the best things about this feature is its flexibility – users can create alerts based on fundamental data, technical indicators, news events, and even portfolio performance changes
-
Watchlists – Keep Track of Potential Investments
Stock Rover’s Watchlists feature allows investors to monitor stocks, ETFs, and mutual funds in one convenient place.
When we tested it, we were able to create custom watchlists for different investment strategies—such as dividend growth stocks, undervalued companies, and high-momentum trades.
The platform also offers pre-built watchlists, including market leaders, top dividend payers, and sector-based lists.
-
Charting & Technical Analysis Tools
Stock Rover’s charting and technical analysis tools provide investors with a flexible way to analyze stock performance, trends, and key financial metrics.
The platform allows users to chart over 100+ financial metrics, including price performance, P/E ratios, earnings growth, dividends, and revenue trends.

Investors can overlay multiple stocks, indices, and benchmark comparisons to see how their holdings stack up.
Unlike trading platforms focused on real-time price action, Stock Rover’s charts are designed for fundamental investors and long-term traders who want to compare historical trends, valuation metrics, and company performance over time.

Stock Rover’s Premium Hidden Gems for Investors
Stock Rover’s Premium plan includes a wide range of additional tools and features. Here are useful additional features that make Stock Rover stand out:
- Data Export: Allows users to export financial data, stock screeners, and portfolio reports into spreadsheets for further analysis or offline tracking.
- 10 Years of Detailed Financial History: Provides access to a decade of historical financial data, helping investors analyze long-term trends, earnings growth, and valuation changes.
- Comparison Tools: Enables side-by-side stock and ETF comparisons across key metrics like returns, valuation, growth, and dividends, making it easier to identify the best investment options.
- Brokerage Integration: Syncs with over 1,000 brokerage accounts, allowing for real-time portfolio tracking and automatic updates without manual data entry.
- Sector & Industry Breakdown: Shows how a stock or portfolio is distributed across sectors and industries, helping with diversification and risk assessment.
- Customizable Views & Metrics: Investors can create personalized dashboards with the exact financial data, ratios, and metrics they want to track.
- Ad-Free Experience & Priority Support: Premium users enjoy a clean, ad-free interface with access to faster customer support for technical issues or questions.
What Are The Limitations?
While Stock Rover Premium offers a powerful stock analysis platform, it’s not without its limitations. Below key limitations that investors should be aware of before committing to the platform:
-
No Real-Time Stock Prices
One major drawback of Stock Rover’s Premium plan is the lack of real-time stock prices.
While it excels in fundamental analysis and long-term investing, the absence of real-time pricing makes it less appealing for active traders who rely on minute-to-minute price movements.
-
Limited Technical Analysis Tools
While Stock Rover has solid stock charting capabilities, it lacks advanced technical analysis tools that active traders rely on.
For example, it does not offer complex indicators, custom scripting for automated strategies, or deep technical pattern recognition.
-
No Stock Ratings or Research Reports
One major drawback of the Premium plan is that it does not include Stock Ratings, a feature reserved for the Premium Plus plan.
Stock Ratings provide an objective scoring system based on metrics like value, growth, quality, and sentiment, helping investors quickly assess a stock’s overall strength.
One surprising limitation is that full access to Research Reports isn’t included with the Premium plan—it requires an additional subscription fee ($49.99/year when bundled, $99.99/year separately).
-
Functional User Interface – But Not the Most Intuitive
Stock Rover offers an incredibly data-rich platform, but the user interface (UI) can feel overwhelming, especially for new users.
While the functional design allows for deep customization, the amount of information displayed at once can create a steep learning curve.
Unlike competitors like Yahoo Finance, TradingView, or Morningstar, which focus on sleek, intuitive layouts, Stock Rover’s UI prioritizes data density over ease of use.
Stock Rover: Ideal for Long-Term Investors?
Stock Rover’s Premium plan is a great choice for investors and traders who rely on fundamental research:
- Long-Term Investors & Buy-and-Hold Investors: Perfect for those who want to research stocks in-depth, analyze fundamentals, and track portfolio performance over years. The 10-year financial history, dividend analysis, and fair value estimates help in making informed long-term decisions.
- Portfolio Managers & DIY Investors: Those managing multiple portfolios will benefit from brokerage integration, portfolio analytics, and rebalancing tools.
- ETF & Mutual Fund Investors: Stock Rover provides detailed ETF and fund research, allowing users to compare performance, expenses, and sector allocations.
- Fundamental Analysts & Research-Driven Traders: Investors who rely on detailed stock analysis instead of technical indicators will find Stock Rover’s financial metrics, ratings, and scoring system invaluable.
Why Day Traders May Not Like Stock Rover
On the other hand, certain types of investors and traders may find it lacking in key areas:
- Technical Analysis-Heavy Traders: Stock Rover has basic charting tools, but it lacks advanced technical indicators, custom scripting, and pattern recognition, which traders using TradingView or ThinkorSwim might need.
- Cryptocurrency Investors: Stock Rover doesn’t support crypto analysis, so those looking to research Bitcoin, Ethereum, or altcoins will need a different platform.
- Casual Investors Who Prefer Simplicity: The platform’s data-heavy interface can feel overwhelming, especially for beginners who just want simple stock research tools.
- Options & Futures Traders: The platform is heavily focused on stocks, ETFs, and mutual funds, with no support for options, futures, or forex trading, making it unsuitable for derivatives traders.
Stock Rover Premium Alternatives: How They Compare?
Stock Rover Premium stands out among its competitors – Finviz Elite, TradingView Plus, Benzinga Basic Pro, MarketBeat All Access, TipRanks Premium, and more – by offering comprehensive fundamental analysis, portfolio tracking, and in-depth stock research.
Plan | Subscription | Promotion |
|---|---|---|
Morningstar Investor | $34.95
$249 ($20.75 / month) if paid annually | 7-Day free trial |
Zacks Premium | $249 ($20.75/month)
No monthly plan | 30-day free trial |
Motley Fool Stock Advisor | $199 (16.60 / month)
No monthly plan
| 30-day money-back guarantee |
Benzinga Pro | $37
$367 ($30.58 / month) if paid annually | $129
$129 for new member’s annual price ($11/month), including 7-day money-back guarantee
|
GuruFocus Premium | $499 ($41.58/ month)
No monthly plan, price for US citizens, price change by region | 7-day free trial + 30-day money-back guarantee |
StockTwits Edge | $22.95
$229.50 ($19.10 / month) if paid annually
| N/A |
Stock Analysis | $9.99
$79 ($6.58 / month) if paid annually | 60-day money back guarantee |
That being said, most competitors offer more user-friendly platforms than SotckRover, and in many cases, a broader set of features for different types of investors.
FAQ
Yes, Stock Rover provides real-time market news for individual stocks and general market trends, with sources like Benzinga and Yahoo Finance integrated into the platform.
While you can access Stock Rover worldwide, the platform only covers U.S. and Canadian stocks, ETFs, and mutual funds, making it less useful for international markets.
No, Stock Rover does not track insider trading activity like some competitor platforms such as MarketBeat or TipRanks.
No, Stock Rover does not provide earnings call transcripts, but it does include earnings reports, analyst estimates, and historical earnings trends.
No, Stock Rover does not provide margin trading tools or calculate the effects of leverage on portfolio performance.
No, Stock Rover is entirely web-based, meaning you need an internet connection to use it—there’s no offline access like some desktop trading platforms.
No, Stock Rover’s customer support is only available during business hours (9 AM – 5 PM EST), and prioritized hotline telephone requires an additional $50 per year.
Review Premium Stock Analysis Tools


How We Rated Premium Investing Analysis & Research Tools
At The Smart Investor, we evaluated premium investment research platforms based on their advanced features, data depth, and overall value compared to other paid alternatives. Each platform was rated based on the following key aspects:
- Advanced Fundamental Analysis Tools (20%): We assessed the depth of financial data, historical reports, earnings forecasts, and valuation models. Platforms that provided institutional-grade insights, DCF analysis, customizable financial models, and access to premium analyst reports scored higher.
- Advanced Technical Analysis Features (20%): We reviewed the availability of real-time charting, advanced indicators, custom scripting, and AI-driven pattern recognition. Platforms that offered backtesting tools, automated trading strategies, and integration with third-party software received better ratings.
- Stock Screener & Premium Filters (15%): A high-quality screener is essential for pro investors, so we evaluated customization depth, real-time filtering, and AI-driven stock discovery. Platforms offering pre-built expert screeners, backtesting capabilities, and sector-specific analytics scored the highest.
- Portfolio Tracking & Advanced Alerts (10%): We rated platforms on their ability to provide real-time performance tracking, portfolio rebalancing tools, and tax optimization insights. Platforms with smart alerts, AI-driven risk assessments, and brokerage integration ranked higher.
- Ease of Use & Customization (15%): We assessed how well premium platforms balance advanced capabilities with user-friendly interfaces. Those offering custom dashboards, API access, and seamless multi-device usability received better ratings.
- Pricing (20%): We considered how the plan's pricing compared to other premium plans and what benefits traders/investors get. Is it worth it overall?
