Table Of Content
Not all stocks are created equal—and fundamental analysis tools help you spot the difference. These platforms give you insight into things like profit margins, balance sheets, growth potential, and competitive strength.
Below are 10 of the most popular tools investors use to analyze a company’s true value.
Top Fundamental Analysis Tools & Websites For Investors
Fundamental analysis tools help investors evaluate a company’s true worth by analyzing its financial health, earnings, and growth.
Here are the top tools and websites to make smarter, long-term stock decisions:
Tool | Key Features | Ideal User |
|---|---|---|
Morningstar | Analyst ratings, fair value estimate | Long-term value investor |
Seeking Alpha | Quant ratings, expert opinions | Informed retail investor |
Zacks | Zacks Rank, earnings revisions | Growth-focused trader |
TradingView | Fundamentals tab, chart overlays | Technical + fundamental user |
Yahoo Finance | Financials summary, fair value | Everyday stock picker |
TipRanks | Analyst ratings, insider activity | Sentiment-driven investor |
Investing.com | Stock screener, earnings calendar | Global market follower |
GuruFocus | Valuation models, insider trades | Value investing enthusiast |
MarketBeat | Analyst upgrades, dividend tracking | Momentum/sentiment trader |
Simply Wall St | Visualized fundamentals, valuation score | Beginner or visual learner |
1. Morningstar
Morningstar is known for its in-depth stock research and analyst-driven ratings.
It covers key financials, historical performance, and forward-looking estimates. Its signature “star rating” system helps investors quickly see how a stock compares to its fair value.
When to use it: Use Morningstar when you want to dig into a stock’s long-term fundamentals or compare stocks within a sector. It’s great for buy-and-hold investors.
Value for investors: Morningstar’s strength lies in its easy-to-understand reports and consistent data layout. If you're looking to evaluate a stock's intrinsic value or understand key risks, it's a solid all-in-one research platform.
2. Seeking Alpha
Seeking Alpha blends crowdsourced investment ideas with financial data. It offers earnings call transcripts, valuation metrics, peer comparisons, and both professional and user-generated analysis.
When to use it: Use Seeking Alpha when you want both numbers and opinions. It’s helpful for exploring bull and bear cases for a stock before making a decision.
Value for investors: The platform helps you think critically by showing multiple viewpoints. Plus, its “Quant Ratings” give you a quick snapshot of a stock’s valuation, growth, profitability, and momentum—all helpful for deeper analysis.

3. Zacks Investment Research
Zacks offers stock rankings based on earnings estimate revisions and surprises. It provides detailed research reports, valuation data, and screening tools based on fundamentals.
When to use it: Use Zacks if you want to spot companies likely to outperform based on improving earnings trends. Great for swing traders or growth-focused investors.
Value for investors: Zacks’ rank system helps you focus on momentum backed by solid fundamentals. It’s a proven approach many investors use to find strong stocks at the right time.
4. TradingView (Fundamentals Tab)
While best known for charts, TradingView also offers a “Fundamentals” tab that shows key financials—like P/E ratios, EPS, dividends, and revenue growth—alongside price charts.
When to use it: Great for investors who want to see how a stock’s fundamentals align with its price trend. Perfect for combining technical and fundamental analysis.
Value for investors: You don’t have to leave your charting platform to review financials. It’s a seamless way to cross-check fundamentals while watching price action.
5. Yahoo Finance
Yahoo Finance’s premium tier unlocks advanced metrics like fair value estimates, forward-looking earnings analysis, and deeper insights into company financials and sectors.
When to use it: Ideal for those who already use Yahoo Finance and want more depth. Helpful when comparing stocks or tracking a watchlist with alerts.
Value for investors: It’s an affordable step up from free tools and offers strong coverage of U.S. and international stocks. You also get curated investment ideas and proprietary data to support smarter decisions.

6. TipRanks
TipRanks aggregates stock ratings and price targets from thousands of Wall Street analysts, hedge fund managers, corporate insiders, and financial bloggers. It scores each expert based on past accuracy and performance.
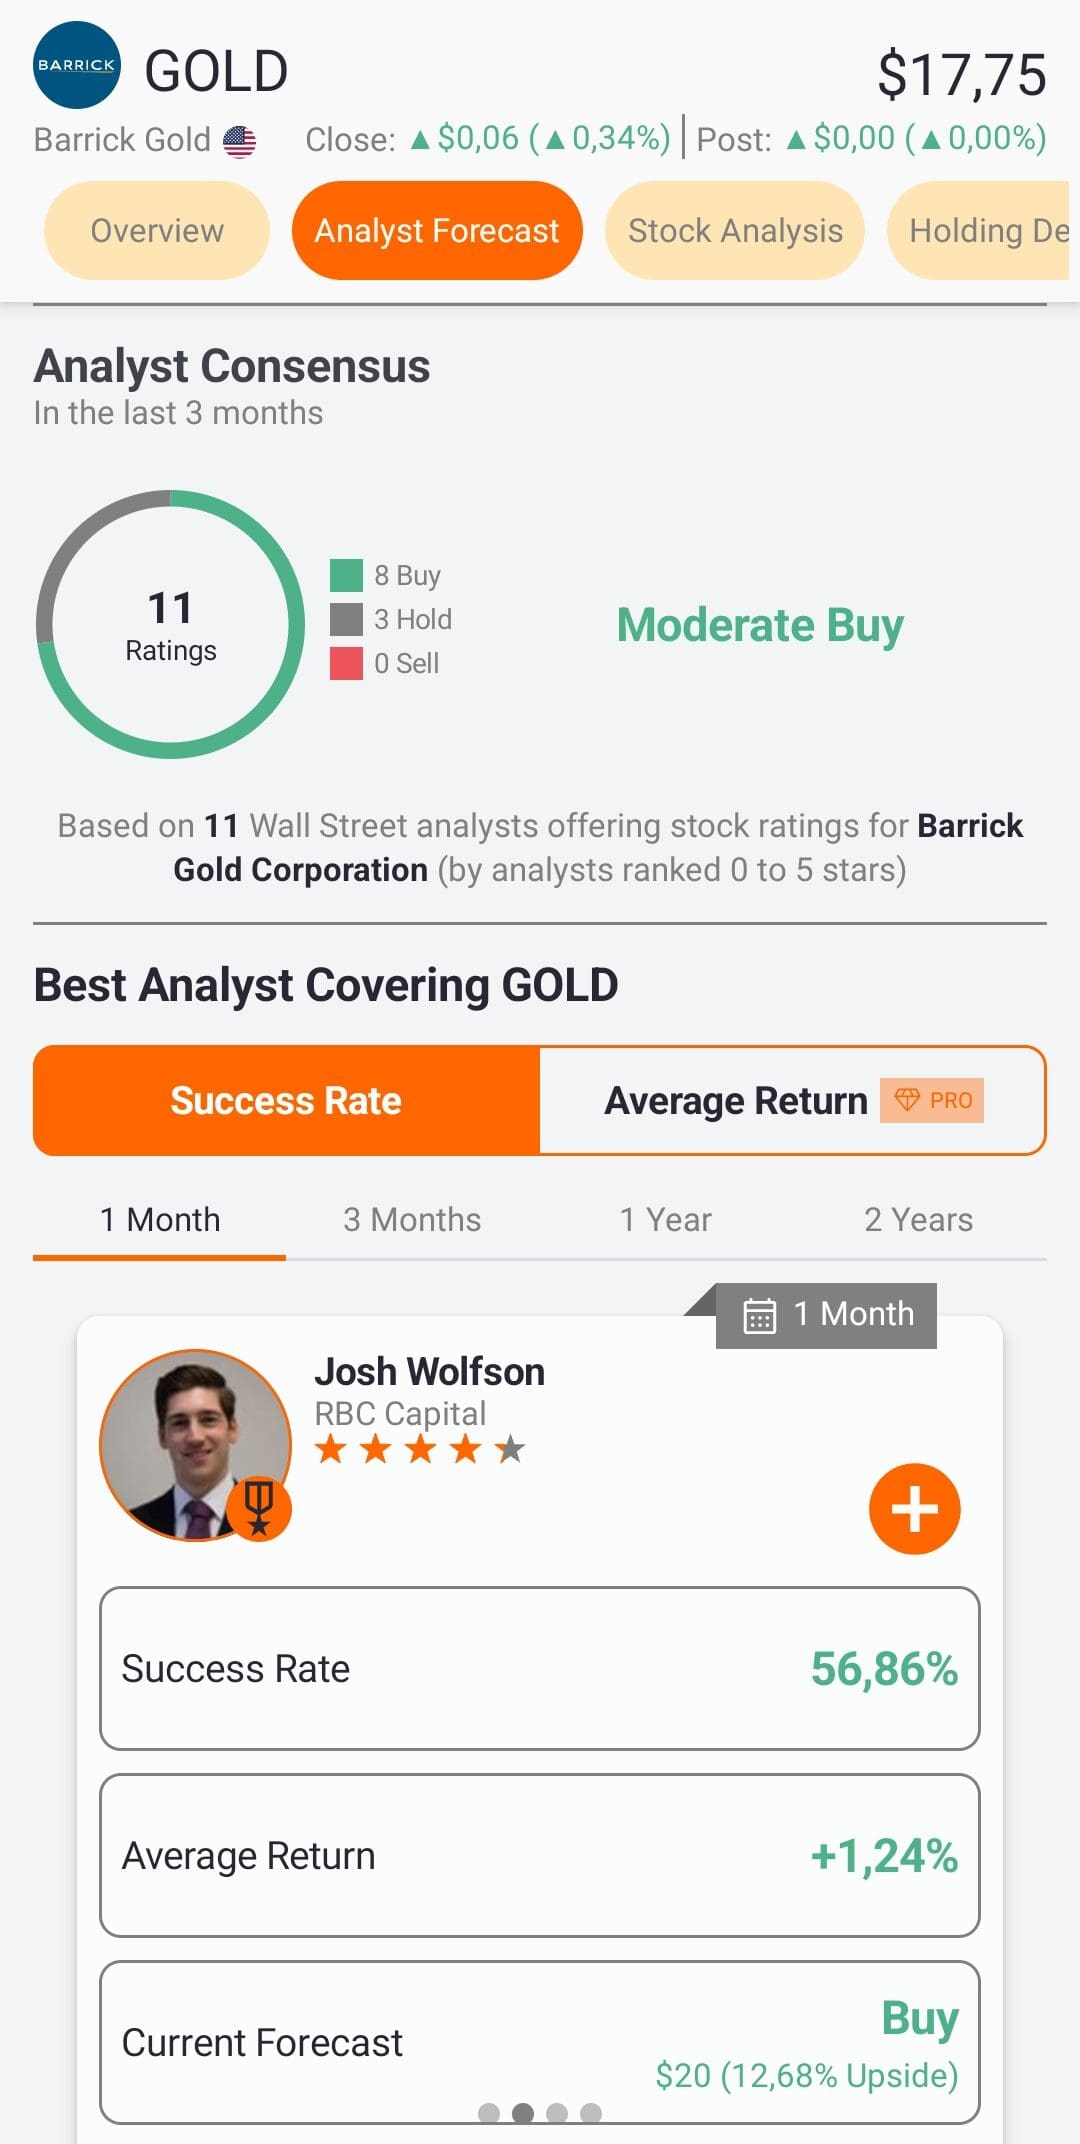
When to use it: Use TipRanks when you want to see what top-rated analysts are saying about a stock—or track sentiment from insiders and institutional investors. It’s great for validating your own ideas.
Value for investors: TipRanks gives you a big-picture view of expert sentiment. You’ll know if the “smart money” is bullish or bearish, and you can filter by the most accurate forecasters, making it easier to focus on quality insights.
7. Investing.com
Investing.com is a global financial platform offering stock screeners, economic calendars, analyst ratings, earnings reports, and financial statements for thousands of companies.
When to use it: Use it when you want a free, well-rounded look at a stock’s fundamentals alongside market news and macroeconomic context. It’s a useful one-stop shop for casual and intermediate investors.
Value for investors: You get access to real-time data, earnings estimates, dividend info, and valuation metrics—all in one dashboard. It’s also helpful for checking how market-wide events might impact the stocks you’re analyzing.

8. GuruFocus
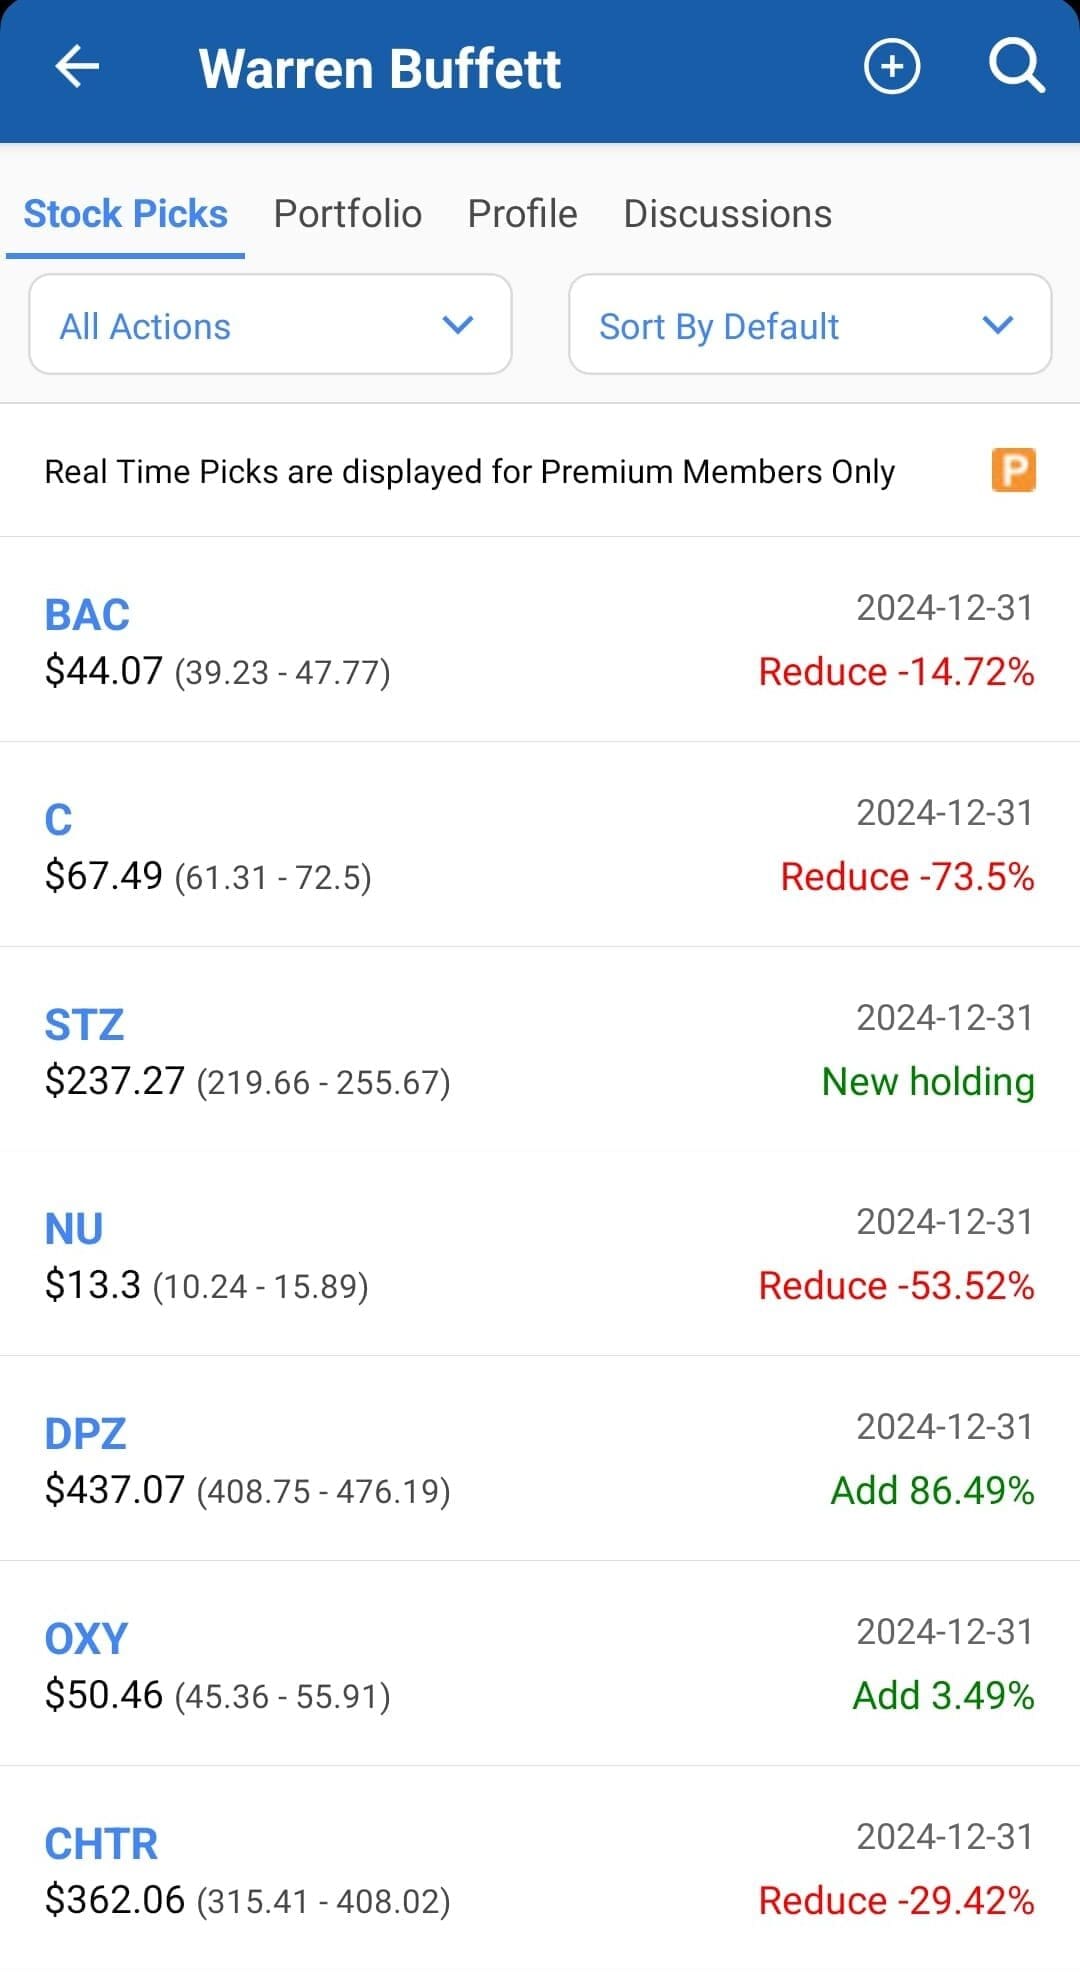
GuruFocus tracks the stock picks of top investors like Warren Buffett and Ray Dalio, while also offering deep-dive fundamental tools like DCF calculators, warning signs, and historical financials.
When to use it: Use GuruFocus when you want to learn from top-performing investors or analyze a company’s financial history in detail. It’s great for long-term value investing.
Value for investors: You’ll get unique insights like insider trades, financial strength ratings, and Buffett-style valuation tools. It’s ideal for investors looking to follow proven strategies or spot undervalued gems.
9. MarketBeat
MarketBeat offers a blend of analyst ratings, dividend data, insider trades, and news headlines.
It aggregates forecasts from Wall Street analysts and highlights consensus ratings, price targets, and upgrades/downgrades over time.
When to use it: Use MarketBeat when you want a quick snapshot of how analysts view a stock or want to monitor insider activity and dividend trends. It’s especially useful for tracking sentiment shifts.
Value for investors: MarketBeat simplifies a lot of valuable data in one place. You can easily see which stocks are gaining attention, how expert sentiment is changing, and whether insiders are buying or selling—helpful clues when evaluating a company’s long-term prospects.

10. Simply Wall St
Simply Wall St turns company fundamentals into easy-to-understand visuals. Think colorful charts that break down a stock’s valuation, past performance, financial health, and future growth.
When to use it: Use this tool when you want to quickly understand a company’s strengths and weaknesses, or to compare multiple stocks side by side.
Value for investors: It’s especially useful for visual learners or beginners. You get a bird’s-eye view of important metrics—like whether a stock is undervalued—without needing to comb through financial reports.
Mistakes to Avoid When Using Fundamental Analysis Tools
Even the best tools can lead to bad decisions if used the wrong way. Investors often get caught up in individual metrics, overlook context, or misuse analyst data. Here are seven common mistakes to watch out for:
Relying on a single ratio or metric – No one number tells the full story; always look at multiple indicators together.
Ignoring industry benchmarks – A “strong” margin in one sector might be average or weak in another.
Over-trusting analyst ratings – Analyst targets can be useful, but they often lag behind real market shifts.
Misreading short-term earnings changes – One great or bad quarter doesn’t define a company’s long-term trajectory.
Focusing too much on historical data – Past performance doesn’t guarantee future success, especially in fast-changing industries.
Using outdated or incomplete data – Always check that the tool pulls current and complete financials before drawing conclusions.
Letting confirmation bias guide analysis – Don’t just seek out data that supports what you already believe—challenge your assumptions.
Understanding the limitations of your tools is just as important as knowing how to use them. It’s the difference between guessing and investing wisely.
FAQ
Free tools can be helpful for basic analysis, but paid platforms usually offer deeper insights, cleaner data, and more advanced features like screeners and valuation models.
Simply Wall St is great for beginners thanks to its easy-to-understand visuals, while Yahoo Finance provides a familiar interface with solid financial data.
Finbox and TIKR Terminal are both strong options—they offer discounted cash flow (DCF) and other model templates using real-time financials.
They’re useful for gauging sentiment, but you should treat them as one piece of the puzzle, not a final verdict.
Fintel and MarketBeat offer great insights into insider buying/selling and hedge fund activity.
Stock Rover offers strong value for the price, with deep screening, watchlist tools, and more than 650 fundamental metrics.
Some tools like TradingView and Yahoo Finance provide real-time or near-real-time data, while others update daily or quarterly depending on the source.
Yes, platforms like TIKR, GuruFocus, and Investing.com offer international stock coverage, although some tools focus mainly on U.S. markets.
Morningstar focuses on long-term fundamentals and valuation, while Zacks emphasizes earnings trends, estimate revisions, and momentum.
Yes, tools like Morningstar, Stock Rover, and Yahoo Finance include ETF and mutual fund screening and analysis alongside individual stocks.
TradingView is ideal—it overlays fundamentals right on price charts, making it easy to track both in one place.
