Table Of Content
Thinking about buying a stock but not sure where to start? You’re not alone.
With so much information out there — earnings, charts, analyst ratings — it’s easy to feel overwhelmed. But here’s the good news: analyzing a stock doesn’t have to be complicated.
In this guide, we’ll break down the process of analyzing a stock so you can feel more confident before hitting that “buy” button.
Which Types of Stock Analysis Should I Consider?
There are several ways to analyze a stock, and each approach gives you a different perspective. Most investors use a mix of these methods to build a more complete picture of a company.
Here are the main types of analysis you should know:
Fundamental Analysis: Focuses on the company’s actual business — revenue, earnings, growth potential, and financial health. You're basically asking, “Is this a good business at a fair price?”
Technical Analysis: Looks at charts and trading patterns. This method helps you understand investor sentiment and find good entry or exit points.
Sentiment Analysis: Tracks what people are saying — including news, social media, or analyst opinions — to gauge market mood.
Each of these has its strengths. Beginners often start with fundamental analysis and add others as they gain experience.
1. Fundamental Analysis
Fundamental analysis evaluates a company’s financial health, business model, and growth potential to determine its intrinsic value.
It involves reviewing financial statements, industry trends, management performance, and economic conditions to decide whether a stock is overvalued or undervalued.
The goal is to identify quality companies trading at attractive prices. Investors often use this method to make long-term decisions based on real business performance, rather than short-term market swings.
Pros | Cons |
|---|---|
Helps identify undervalued opportunities | Time-consuming to research and analyze |
Focuses on long-term business value | Assumptions may not account for market shifts |
Reduces emotional or hype-driven decisions | Results may take time to materialize |
Useful across all market conditions | Not ideal for short-term or momentum trading |
-
When and Why to Use Fundamental Analysis
Fundamental analysis is most useful when you're investing with a long-term mindset. If your goal is to buy and hold stocks for years — not just days or weeks — understanding the core of the business is key.
This approach helps you avoid hype-driven stocks and instead focus on companies with strong revenue, solid earnings, and sustainable competitive advantages.
You might use fundamental analysis when comparing companies in the same sector, deciding whether a stock’s recent dip is a buying opportunity, or evaluating new additions to your portfolio.
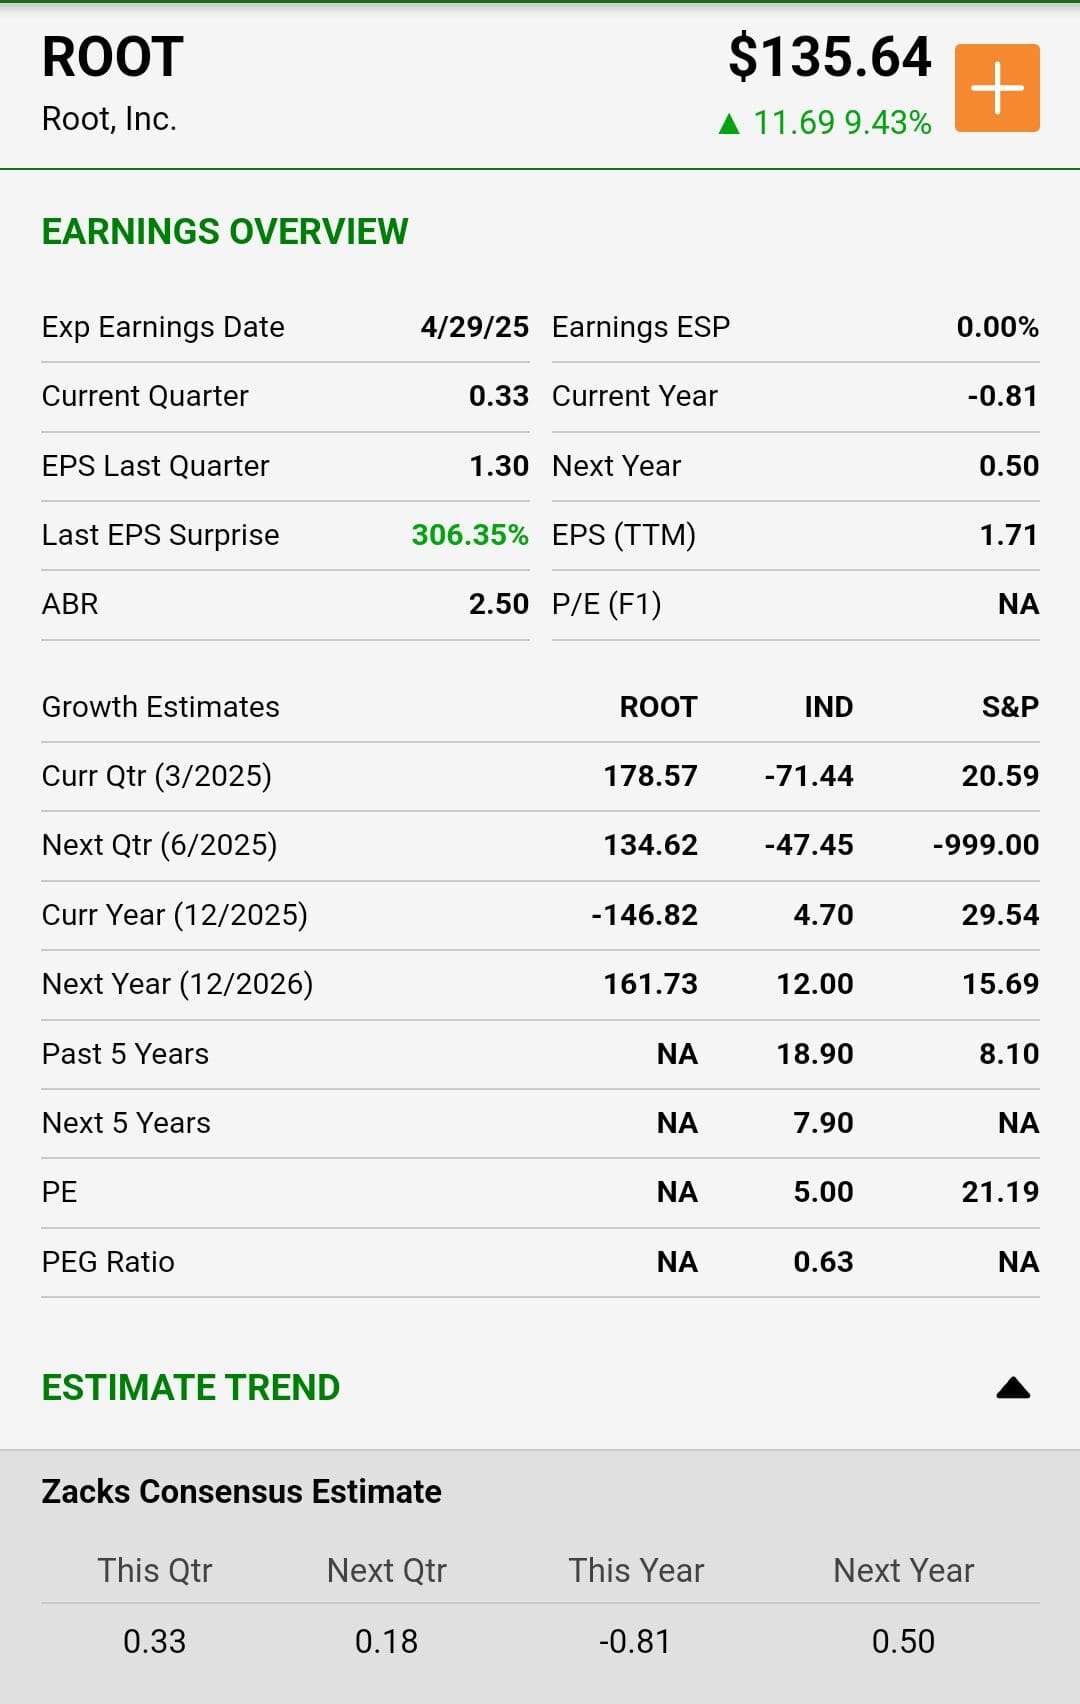
Platforms like Morningstar, Yahoo Finance, and Zacks provide easy access to these metrics, along with company overviews and historical performance data.
-
Key Ratios Used in Fundamental Analysis
Price-to-Earnings (P/E) Ratio: Compares a company’s stock price to its earnings. A lower P/E may suggest a stock is undervalued.
Return on Equity (ROE): Measures how efficiently a company generates profits from shareholders’ investments.
Debt-to-Equity Ratio: Assesses how much a company relies on borrowed money versus owned capital. Lower ratios are generally safer.
Current Ratio: Indicates whether a company can cover short-term liabilities with its short-term assets. A ratio above 1 suggests good liquidity.
2. Technical Analysis
Technical analysis studies stock price movements, trading volume, and chart patterns to forecast future price behavior.
Instead of looking at a company’s financials or fundamentals, it focuses on what the stock is actually doing in the market — identifying trends, momentum, and potential entry or exit points.
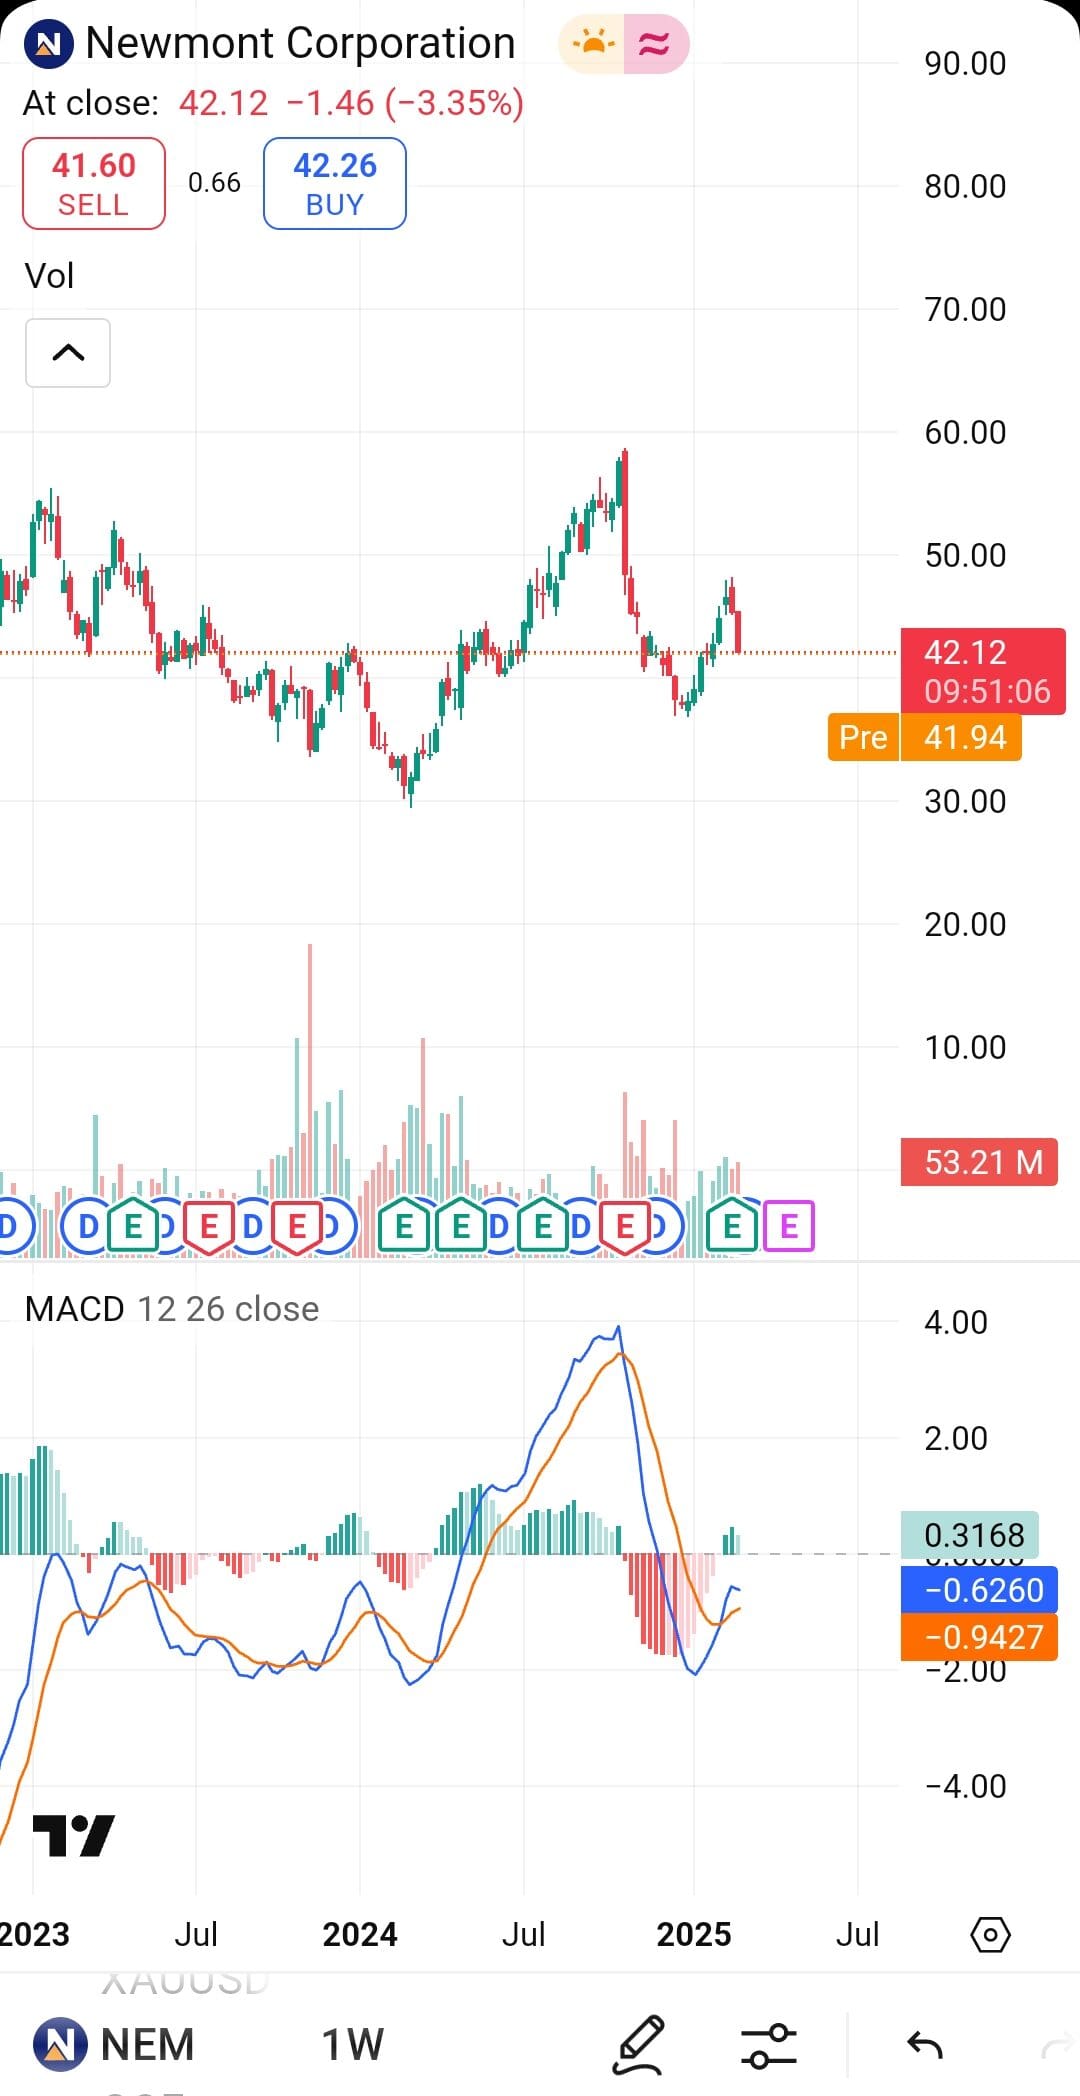
Traders use tools like moving averages, support and resistance levels, and indicators like RSI or MACD to make informed decisions.
The idea is that market behavior often repeats itself, so analyzing historical data can help predict what might happen next. It’s especially popular for short-term trading and timing decisions.
Pros | Cons |
|---|---|
Helps identify entry and exit points | Doesn’t reflect business fundamentals |
Useful for short-term trading | Can give conflicting signals |
Based on actual price behavior | Requires practice and interpretation |
Widely used by traders across all markets | May not predict long-term outcomes accurately |
-
When and Why to Use It?
Technical analysis is ideal for active traders and investors who want to time their buy or sell decisions more precisely.
It’s especially helpful in short- to medium-term trading strategies where market timing matters — such as swing trading, day trading, or identifying breakout points.
It’s also useful when monitoring current positions, spotting potential trend reversals, or confirming buying signals.
When combined with fundamental research, technical tools can offer an extra layer of confidence and help improve your decision-making process.
Tools like TradingView, Barchart, and StockCharts make it easy to plot these indicators and identify trends, support/resistance levels, and patterns like breakouts or reversals.
-
Key Tools Used in Technical Analysis
Moving Averages (50-day/200-day): Smooth out price data to identify trends. A rising 200-day average suggests long-term strength.
Support and Resistance: Key price levels where stocks often bounce or reverse. Traders use them to plan entries and exits.
Relative Strength Index (RSI): Measures whether a stock is overbought or oversold. RSI above 70 can suggest a pullback is coming.
MACD (Moving Average Convergence Divergence): Identifies momentum and potential trend reversals through signal line crossovers.
3. Sentiment Analysis
Sentiment analysis looks at what people think and feel about a stock — and how that collective mood might influence its price.
It involves monitoring news articles, analyst reports, social media, forums, and other public sources to gauge investor sentiment.
This can be done manually or with tools that scan and analyze large amounts of text using AI or natural language processing.
The idea is simple: stock prices don’t move on fundamentals alone — they also move on perception.
Pros | Cons |
|---|---|
Captures market mood in real time | Can be driven by hype or misinformation |
Helps anticipate short-term price movements | May cause overreactions to irrelevant news |
Complements other types of analysis | Sentiment shifts quickly and can be hard to predict |
Useful for trading trending or volatile stocks | Requires filtering noise from meaningful signals |
-
When and Why to Use It
Sentiment analysis is especially useful in fast-moving markets or for short-term traders trying to anticipate price moves before they happen. It’s often used to detect investor enthusiasm, panic, or changing narratives — all of which can influence demand for a stock.
You might use sentiment analysis when trading volatile stocks, earnings plays, or companies frequently in the news (think Tesla or Nvidia).
It can also complement fundamental or technical research by helping you understand the market mood — for instance, whether a dip is being shrugged off or sparking fear.
Tools like StockTwits, MarketBeat, and Twitter feeds can offer real-time sentiment snapshots. While sentiment alone shouldn't drive your decisions, it can be a valuable signal — especially when the crowd’s emotions are clearly moving prices.

-
Key Tools Used in Sentiment Analysis
News Headlines and Analyst Ratings: Upgrades, downgrades, or major news coverage can shift sentiment rapidly.
Social Media Platforms (Twitter, Reddit): Real-time public conversations can reflect hype, rumors, or crowd excitement.
StockTwits and MarketBeat Sentiment Scores: Offer visual representations of bullish vs. bearish sentiment.
Earnings Call Transcripts: Tone of language and keyword trends from executives can sway investor confidence.
Google Trends or Search Volume: Spikes in search traffic often precede big moves, especially for trending stocks.
How to Know Which Type of Analysis Is Best for You
The best type of analysis for you depends on your investing style, goals, and time horizon.
If you’re a long-term investor focused on owning quality companies for years, fundamental analysis is likely your best fit. It helps you understand the health, value, and future potential of a business — perfect if you want to “buy and hold” like Warren Buffett.
If you prefer short-term trades, such as buying and selling over days or weeks, technical analysis is more useful. It helps you spot price trends, breakouts, or reversals — ideal for timing your entries and exits.
If you’re trying to catch fast-moving opportunities or trade volatile stocks, sentiment analysis can give you an edge. It tells you how the market is feeling — which often drives prices in the short term.
Many investors end up using a combination.
For example, you might use fundamentals to choose a strong stock, then technicals to decide when to buy it, and sentiment to confirm whether the timing feels right.
The more you practice, the clearer your personal style will become.
FAQ
Stock screeners filter stocks based on criteria like valuation, performance, or industry to help you narrow down potential investments.
They can offer useful insight, but you should always do your own research and understand the assumptions behind the ratings.
You can use websites like Finviz or MarketBeat to see if executives or directors are buying or selling shares in their own company.
High institutional ownership may suggest confidence from big investors, but sudden shifts can lead to sharp price moves.
A consistent or growing dividend can indicate financial health, but you should also evaluate earnings and payout ratios.
Dilution reduces your share of earnings, so check if the company frequently issues new shares or raises capital.
Beta measures volatility compared to the market. A beta above 1 means higher risk and potentially higher reward.
Not exactly — with ETFs, you evaluate the fund’s holdings, fees, and performance, rather than company-specific fundamentals.
Revisit your analysis quarterly or when big news hits, like earnings reports or major industry changes.
Inflation affects interest rates and consumer spending, which can impact company costs and profits — especially in rate-sensitive sectors.
If the company does a lot of international business, currency swings can impact revenue and should be factored into your analysis.
