Table Of Content
What Is a Stock Quote and Why Is It Important?
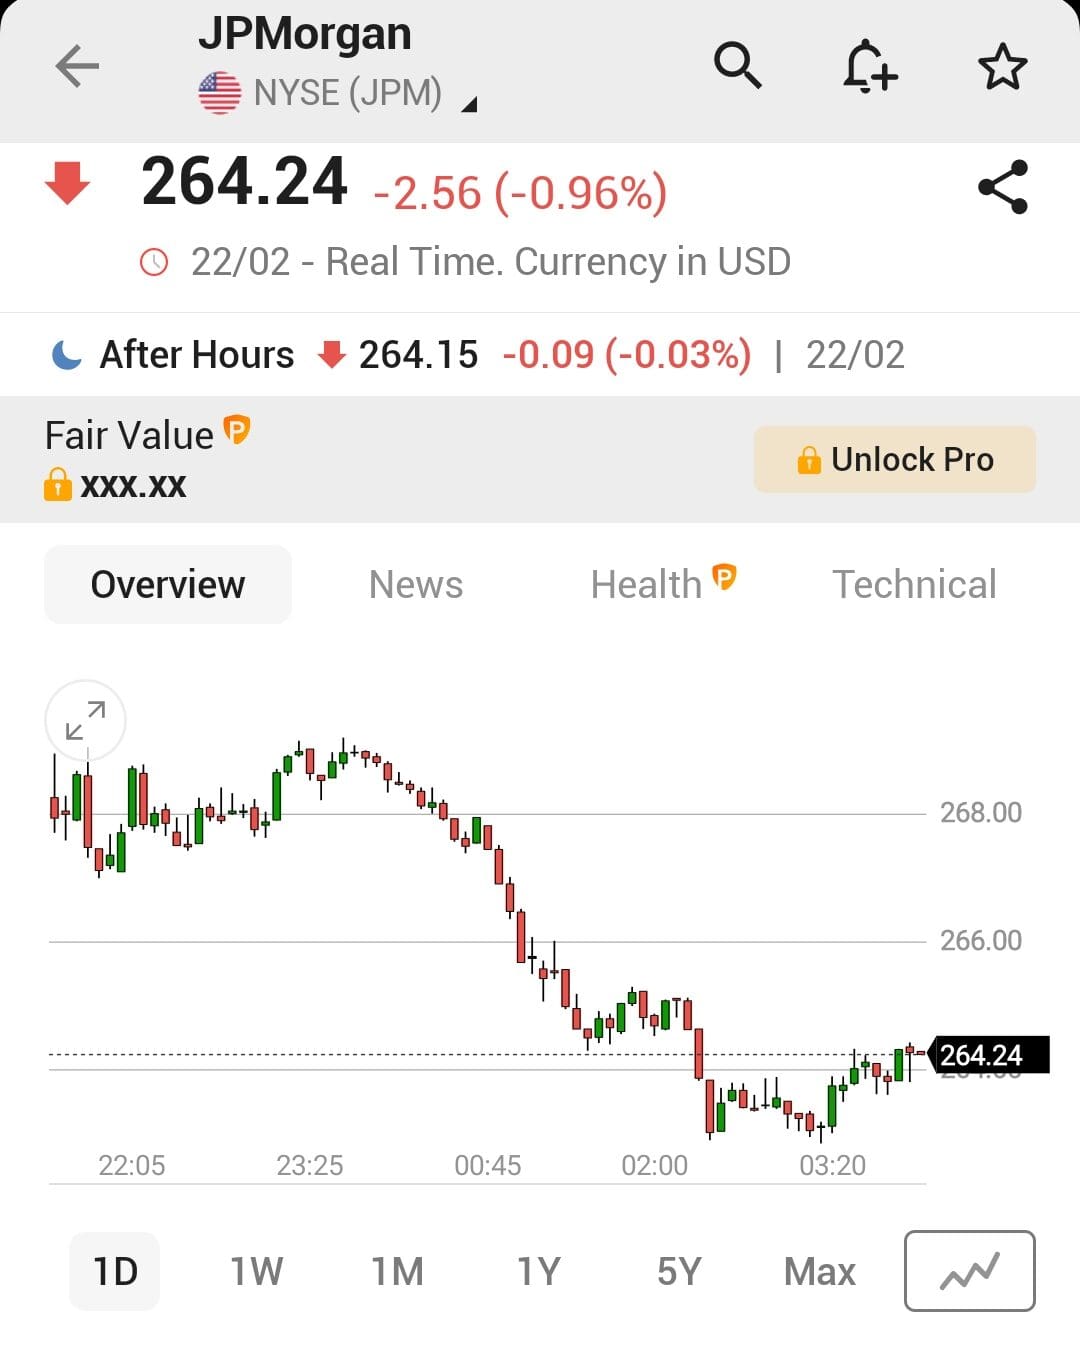
A stock quote is a snapshot of a company’s current trading activity on the stock market. It provides essential pricing and performance data that helps investors make real-time decisions.
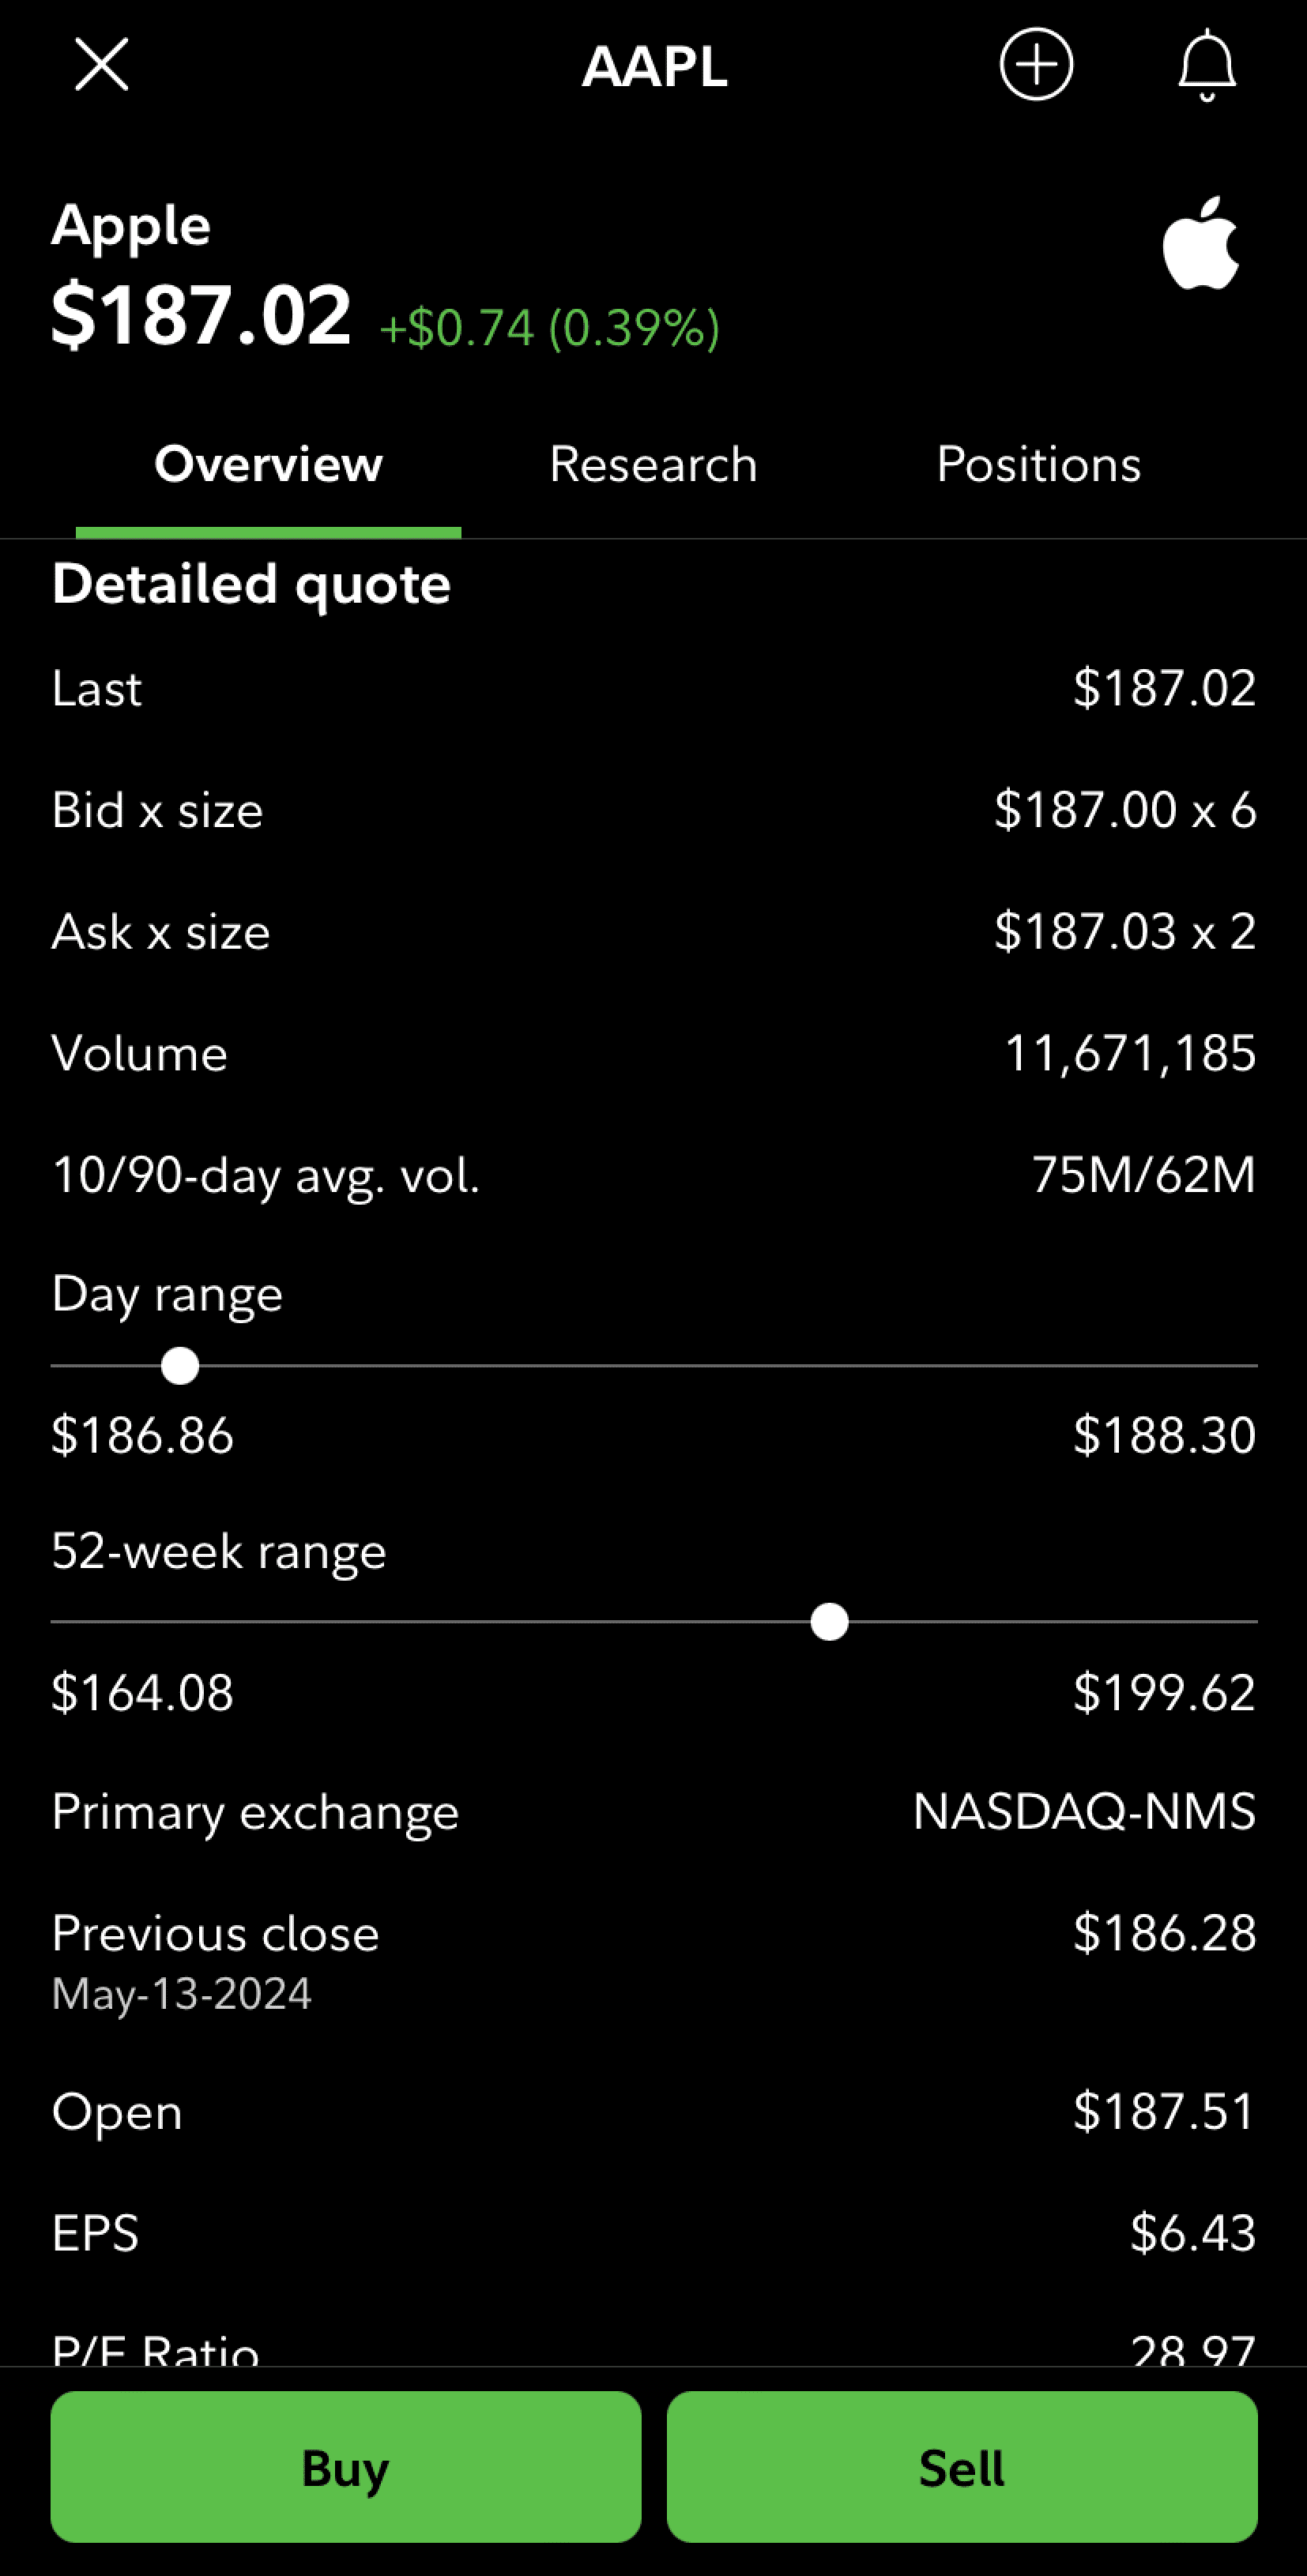
Pricing Transparency: A stock quote shows the current price of a stock, helping investors determine if it's a good time to buy, hold, or sell. For example, if Apple (AAPL) is trading at $175, investors can compare this to historical prices or valuation metrics.
Real-Time Market Sentiment: Quotes update constantly during trading hours, reflecting changes in supply and demand. A sudden price spike may indicate breaking news or investor optimism.
Comparison Tool: By comparing quotes of different companies in the same sector (e.g., Microsoft vs. Google), investors can assess relative performance and identify better value or momentum opportunities.
Entry and Exit Timing: For active traders, quotes are key for executing trades at desired price levels, especially when using limit orders.
Stock quotes are crucial for all types of investors, from long-term holders to day traders. Without them, it would be nearly impossible to react to market conditions in real time.
How to Read the Key Components of a Stock Quote
Understanding stock quotes helps investors evaluate pricing, volume, and value before making trading decisions, as each component tells a unique story.
Let's explore them:
-
Bid / Ask Price
The bid is the highest price a buyer is currently willing to pay for a stock. For example, if the bid for Tesla (TSLA) is $700, it means there’s at least one buyer willing to purchase it at that price.
The ask is the lowest price a seller is willing to accept for their stock. If the ask for Amazon (AMZN) is $3,200 and the bid is $3,190, a buyer would need to match or exceed the $3,200 to get their order filled instantly.
A tight bid-ask spread (e.g., bid $700, ask $701) often indicates high liquidity. In contrast, a wider spread suggests less trading activity or uncertainty in pricing.
-
Day’s High and Low
These values show the highest and lowest prices the stock has traded at during the current trading session.
For instance, if Meta (META) opened at $250, hit a high of $258, and a low of $246, it shows the volatility range for that day.
This is valuable for intraday traders seeking to buy near the low and sell near the high. It also signals market momentum and investor sentiment shifts within a single day.
-
Volume
Volume tells you how many shares have been traded during the day. A stock with 20 million shares traded, like Nvidia (NVDA), shows high investor interest and liquidity.
For example, if news breaks about a new chip release and volume spikes, it could validate a strong price move.
Low volume, on the other hand, may indicate weak conviction or limited demand, making it harder to enter or exit positions efficiently.
-
Market Cap (Market Capitalization)
Market cap represents the total value of a company's outstanding shares, calculated as share price × total shares.
For example, if Apple’s stock price is $175 and it has 16 billion shares outstanding, its market cap is $2.8 trillion.
This metric helps investors categorize companies into small-cap, mid-cap, or large-cap. Also, market cap is critical when comparing companies of different sizes within the same sector.
-
P/E Ratio (Price-to-Earnings Ratio)
The P/E ratio shows how much investors are willing to pay per dollar of earnings.
If Alphabet (GOOGL) trades at $140 and its earnings per share (EPS) is $7, the P/E ratio is 20. A higher P/E might suggest high growth expectations, while a lower one could signal undervaluation or poor outlook.
For example, comparing the P/E of Coca-Cola vs. Pepsi can help value-focused investors decide which is cheaper relative to earnings.
-
Beta (Volatility Measure)
Beta measures a stock’s volatility compared to the overall market. A beta of 1.0 means the stock typically moves in line with the S&P 500. A beta of 1.5 means it’s 50% more volatile than the market.
For example, Tesla has a high beta, making it attractive to aggressive traders.
A utility stock with a beta under 0.7, on the other hand, is less volatile and more suitable for conservative portfolios.
-
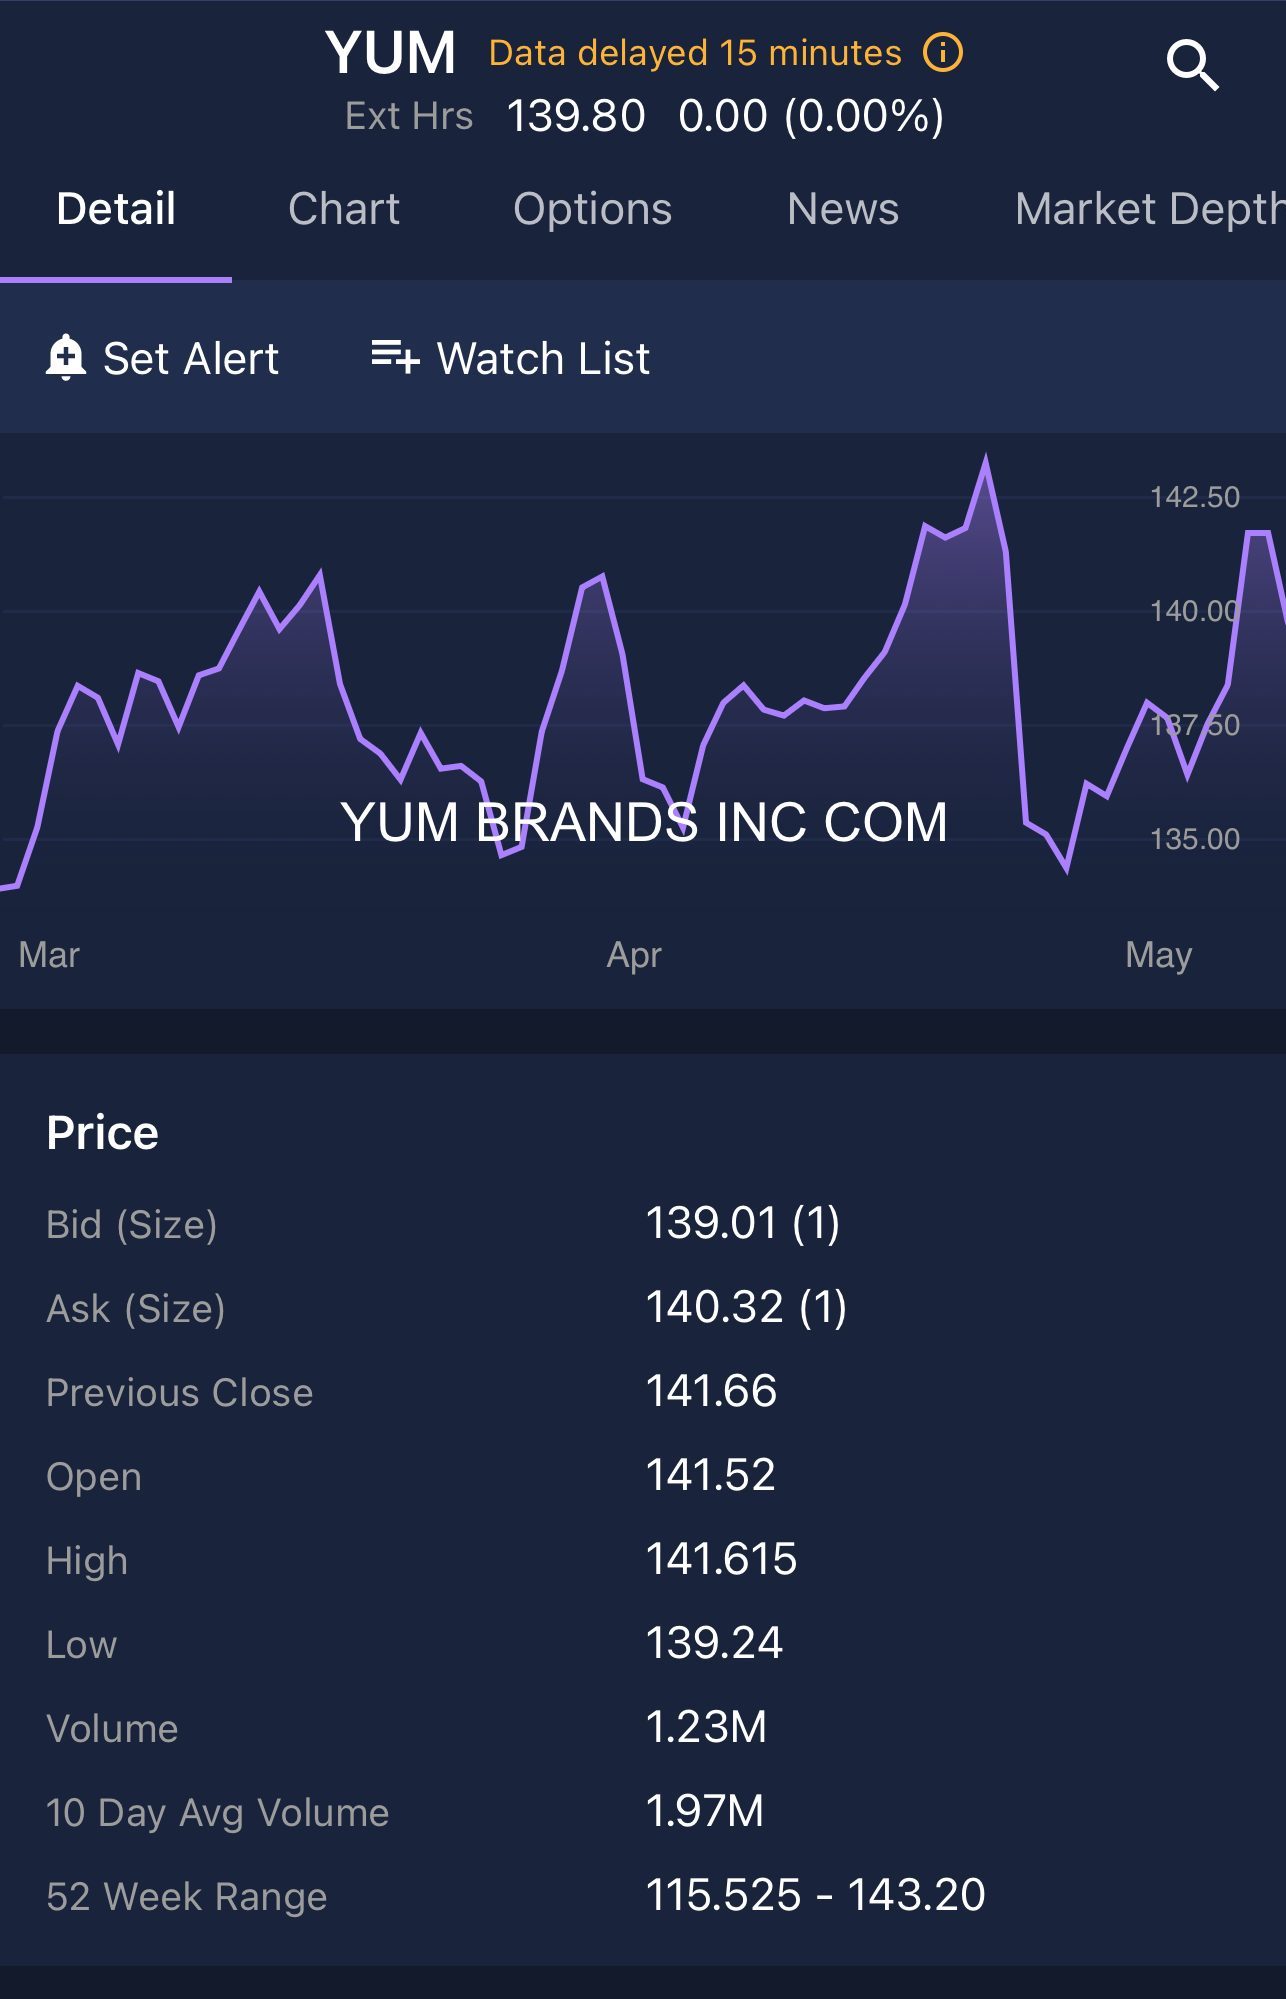
52-Week High and Low
These figures reflect the highest and lowest prices over the past 12 months.
For example, if Netflix (NFLX) is trading at $380 with a 52-week high of $390 and a low of $250, it tells you how close the current price is to long-term extremes. Long-term investors use this range to assess valuation and timing.
A stock near its 52-week low might attract bargain hunters, while one near its high could indicate strong momentum or be seen as overbought.
Where to Find Stock Quotes Online
Real-time and historical stock quotes are easily accessible on a variety of financial websites and brokerage platforms designed for investors.
Yahoo Finance: One of the most popular free resources. You can view real-time quotes, historical data, analyst ratings, and create watchlists. For example, typing “AAPL” reveals Apple’s bid-ask spread, volume, and P/E ratio on one page.
Google Finance: Simple and user-friendly. It shows basic quote details alongside recent news and stock performance charts. Ideal for quick lookups on both desktop and mobile.
Bloomberg: Offers institutional-grade stock data, though some features are behind a paywall. A good source for comprehensive metrics, such as beta, dividend yield, and market capitalization.
Online brokers (e.g., Fidelity, E*TRADE, Charles Schwab): These platforms display real-time quotes with full details, including pre- and after-hours pricing.
Each platform serves different levels of investor experience — from quick lookups to deep analysis.
FAQ
A stock quote typically includes the current price, bid and ask, daily high and low, volume, market cap, and other trading metrics. These details help investors assess the stock’s performance and trading activity.
Stock quotes update in real-time or with slight delays, depending on the platform. For active traders, using a platform with live data is essential.
The bid price is the highest price a buyer is willing to pay for a stock. It’s important for sellers looking to execute trades quickly.
The ask price is the lowest price a seller is willing to accept. Investors buying at market price usually pay the current ask.
Volume shows how many shares have been traded in a day, indicating investor interest and liquidity. High volume often confirms strong price moves.
These figures represent the highest and lowest prices the stock has traded at during the current session. It reveals the day’s volatility range.
Market cap reflects a company’s size and can indicate risk or stability. Larger companies tend to be more stable, while smaller ones may offer growth potential.
The P/E ratio reveals how much investors are paying for each dollar of earnings. A high P/E may signal growth expectations or overvaluation.
Earnings per share shows profitability on a per-share basis. It helps investors compare performance across companies of different sizes.
