What Is a Penny Stock Scanner?
A penny stock scanner helps traders identify low-priced stocks meeting specific criteria. These scanners allow users to filter stocks based on volume, price action, technical patterns, and fundamental data.
Because penny stocks are volatile and trade in large numbers, a scanner helps cut through the noise and spot opportunities faster.
For example, a trader might use a scanner to find stocks under $5 with a sudden spike in volume, signaling a possible breakout.
How Penny Stock Scanners Help Investors and Traders
Penny stock scanners provide a major advantage by helping investors and traders navigate fast-moving, high-risk markets with precision and speed.
Save Time by Filtering Out the Noise: With thousands of stocks under $5, manually sifting through them is inefficient. Scanners quickly narrow down the list based on volume, price, sector, or news catalysts—letting you focus only on actionable setups.
Spot Momentum Early: By scanning for surging volume or technical breakouts, you can catch potential winners early—before the bulk of traders pile in. This is crucial in penny stocks where moves can be short-lived.
Reduce Risk of Chasing Trades: Using a scanner helps you set pre-defined filters, avoiding emotionally driven trades. You’ll only act on stocks that meet your criteria, such as low float and high relative volume.
Identify Repeatable Patterns: Over time, scanners help you notice recurring setups—like low float stocks breaking resistance after earnings. As a result, you can build a trading strategy around proven scenarios.
Mastering Penny Stock Scanners: Key Strategies
Penny stock scanners can uncover strong trading setups—but only if you apply clear strategy, smart filters, and disciplined analysis to your scans.
-
Define a Clear Trading Strategy Before Scanning
Start by outlining what kind of setups you're targeting—such as breakouts, volume spikes, news-based moves, or technical reversals.
Without clarity, you'll end up scanning aimlessly, which leads to low-quality trades and unnecessary risk.
Example strategy-based filters:
Breakout traders should scan for penny stocks approaching recent highs, with relative volume 2x or more, and price momentum indicators like RSI > 60.
Swing traders may prefer filters based on daily moving average support (50-day or 200-day) combined with bullish candlestick patterns.
News-based traders can use platforms like Benzinga Pro to filter by stocks with press releases or insider buying within the last 24 hours.
By starting with intent, your scanner becomes a precision tool—not just a list of random tickers.
-
Scan During Key Market Hours for Best Results
Timing your scans to match periods of high activity increases your chance of finding actionable setups.
The most profitable moves in penny stocks often happen within the first 60–90 minutes of market open or during pre-market sessions when news catalysts drop.
When and how to scan:
Pre-market (8:00–9:30 AM ET): Scan for gap-ups of 5% or more, especially in stocks with fresh earnings, biotech approvals, or low-float setups.
Opening bell (9:30–10:30 AM ET): Use filters that show top percentage gainers with volume above average in the first 15–30 minutes of trading.
Use scanners with real-time feeds like Webull, Benzinga Pro, or Trade Ideas to catch moves as they develop—not after they peak.
Scanning at the right time puts you in front of moves—so you can prepare, not just react.
-
Use Volume and Float Filters to Spot Explosive Stocks
Penny stocks move fast—especially when they have low floats and rising volume.
Combining these filters allows you to spot “low supply, high demand” situations, often leading to double-digit intraday gains or squeezes.
Powerful filter combinations:
Float under 50 million shares indicates low supply; under 20 million is ideal for big price swings with moderate volume.
Current volume > 2x or 3x average daily volume helps confirm increased demand and trader attention.
Price gain > 5–10% intraday shows strength; when paired with news or technical breakout, it’s often the start of a larger move.
This combination—low float, rising volume, and price momentum—is a proven formula for finding explosive penny stocks.

-
Validate Scanner Picks Using Technical Charts
Once a stock hits your scanner, it’s time to evaluate the chart.
The scanner tells you what is moving, but the chart tells you why it matters. Without technical confirmation, you risk jumping into moves that are already overextended or unsupported.
What to check on the chart:
Check for key resistance or breakout levels, especially near daily highs, round numbers (like $1.00 or $2.00), or previous failed highs.
Use volume-by-price overlays or VWAP to see if a move is supported by heavy interest or just a temporary pop.
Confirm pattern setups like flags, triangles, or consolidation zones, which suggest continuation or breakout potential.
This step separates a high-probability setup from a stock that’s just temporarily spiking.

-
Create a Tracker to Improve Future Scans
To turn short-term wins into long-term consistency, you need to track what’s working. Keeping a scanner journal or spreadsheet helps identify recurring characteristics of winning setups—and filters out patterns that repeatedly fail.
How to build and use your tracker:
Log scanner hits daily, including float size, news catalyst, price range, volume, and next-day performance. This gives you measurable data to refine future filters.
Identify winning setups by sector or catalyst, such as biotech FDA approvals or short squeeze plays in low-float financial stocks.
Refine your filters weekly or monthly based on win/loss rates—not emotions. Adjust float ranges, tighten volume rules, or filter for more specific catalysts.
Over time, this habit gives you a personalized blueprint for how to scan and trade penny stocks with discipline and consistency.
Free vs. Paid Penny Stock Scanners: Which One to Use?
Choosing between free and paid penny stock scanners depends on individual trading needs, experience level, and budget.
- Free scanners are suitable for beginners or those with limited budgets. They offer basic filtering options and are often sufficient for casual trading. However, they may lack real-time data, advanced charting tools, and comprehensive news integration.
- Paid scanners, on the other hand, provide advanced features such as real-time data feeds, customizable alerts, in-depth technical and fundamental analysis tools, and integration with brokerage accounts.
These tools are beneficial for active traders who require timely information and advanced functionalities to make informed decisions.
Here's a comparison to help decide:
Leading Penny Stock Scanners Available Today
Selecting the right penny stock scanner can significantly impact trading success. Here are some top scanners known for their features and reliability:
Finviz: Provides both free and premium versions with a user-friendly interface, offering a range of filters and visualizations suitable for swing traders.
TradingView: Offers a robust free version with advanced charting and a wide range of indicators, suitable for both beginners and experienced traders.
Investing.com Screener: This free and user-friendly screener offers filters for technical and fundamental metrics. While it lacks real-time scanning, it's useful for identifying stocks with earnings surprises or analyst revisions.
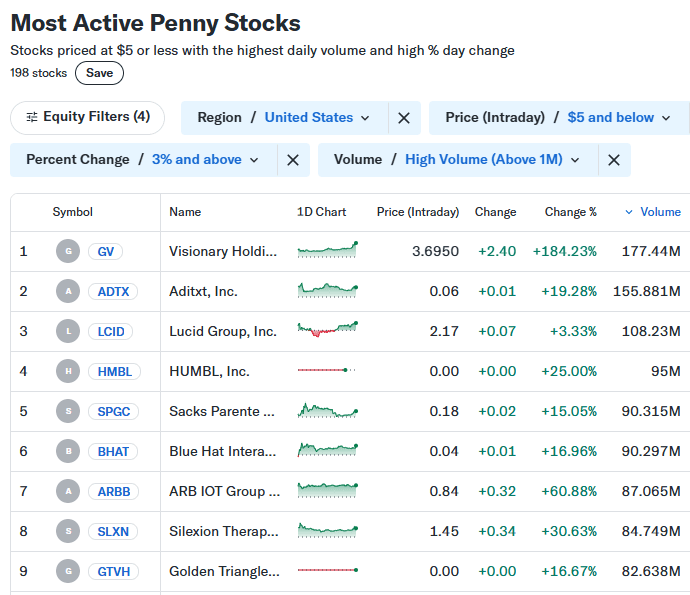
Yahoo Finance: This is one of the best free screeners available, with many options, including penny stocks.
Zacks Premium Screener: Ideal for value or growth investors looking at under-$5 stocks with strong Zacks Rank ratings. The premium screener helps find penny stocks with upward earnings revisions and institutional buying trends.