If you’re a trader looking to improve your charting skills, the best charting tools can make all the difference. These tools give you detailed charts and technical indicators to help you spot trends and make smarter trades.
Let’s explore the top charting tools that every trader should know about.
TradingView
Monthly Subscription
Promotion
Our Rating
Best For
- Overview
- Features
- Pricing & Plans
- Platform Screenshots
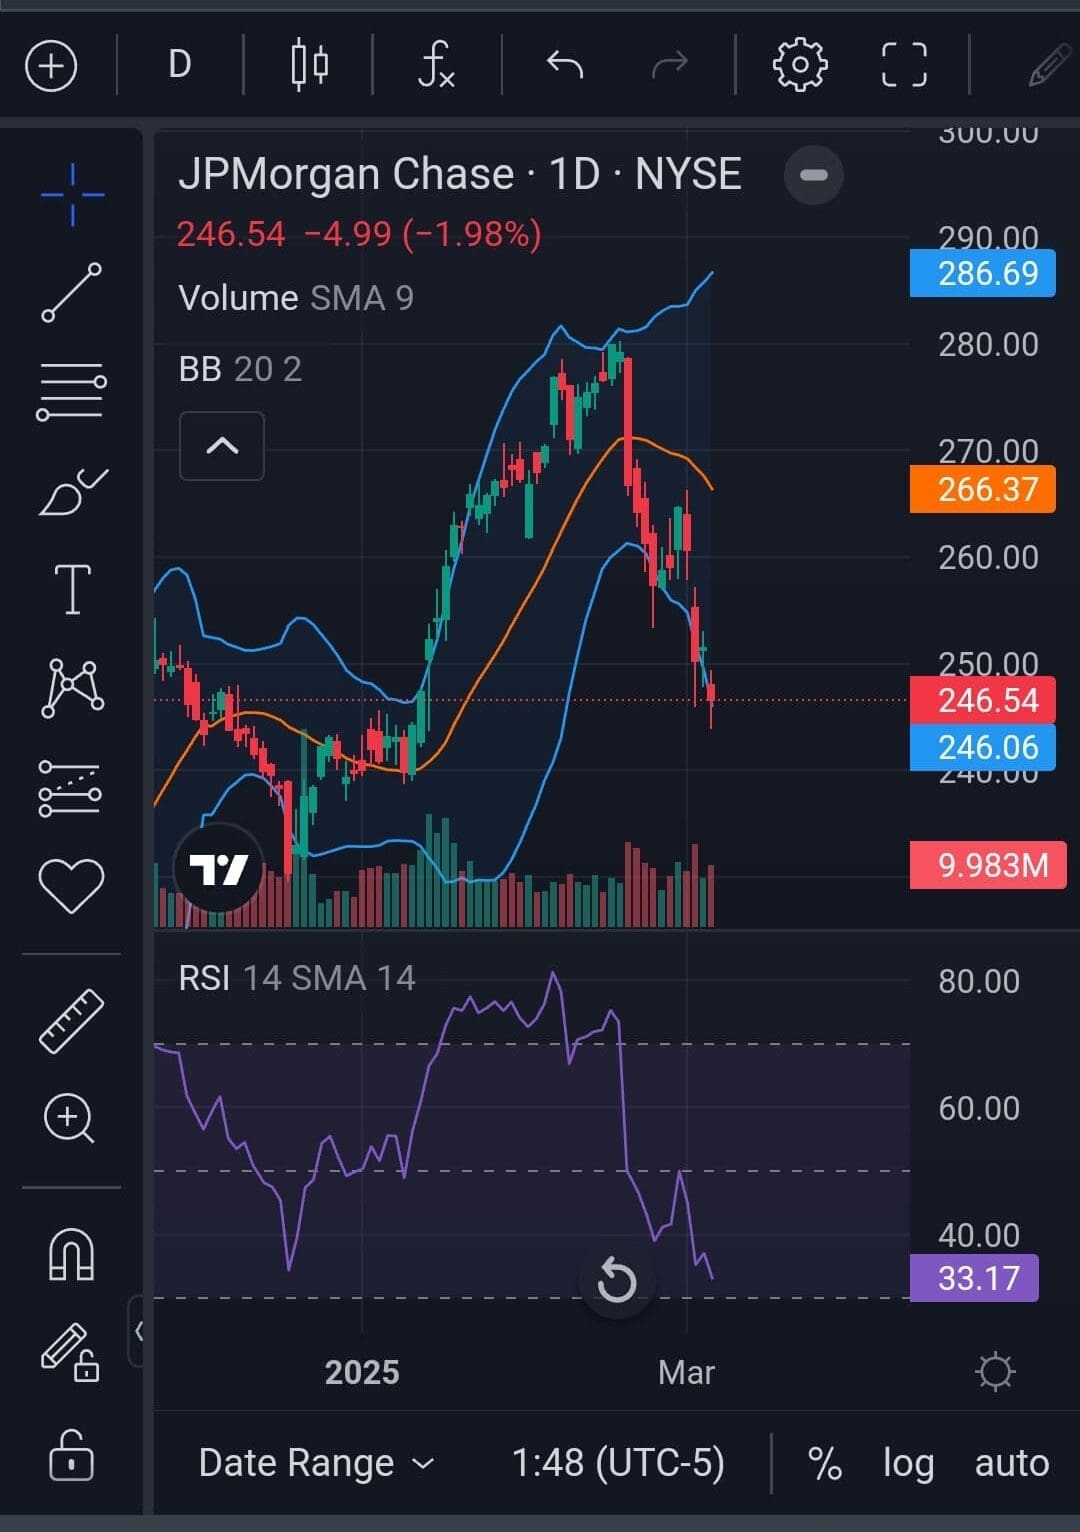
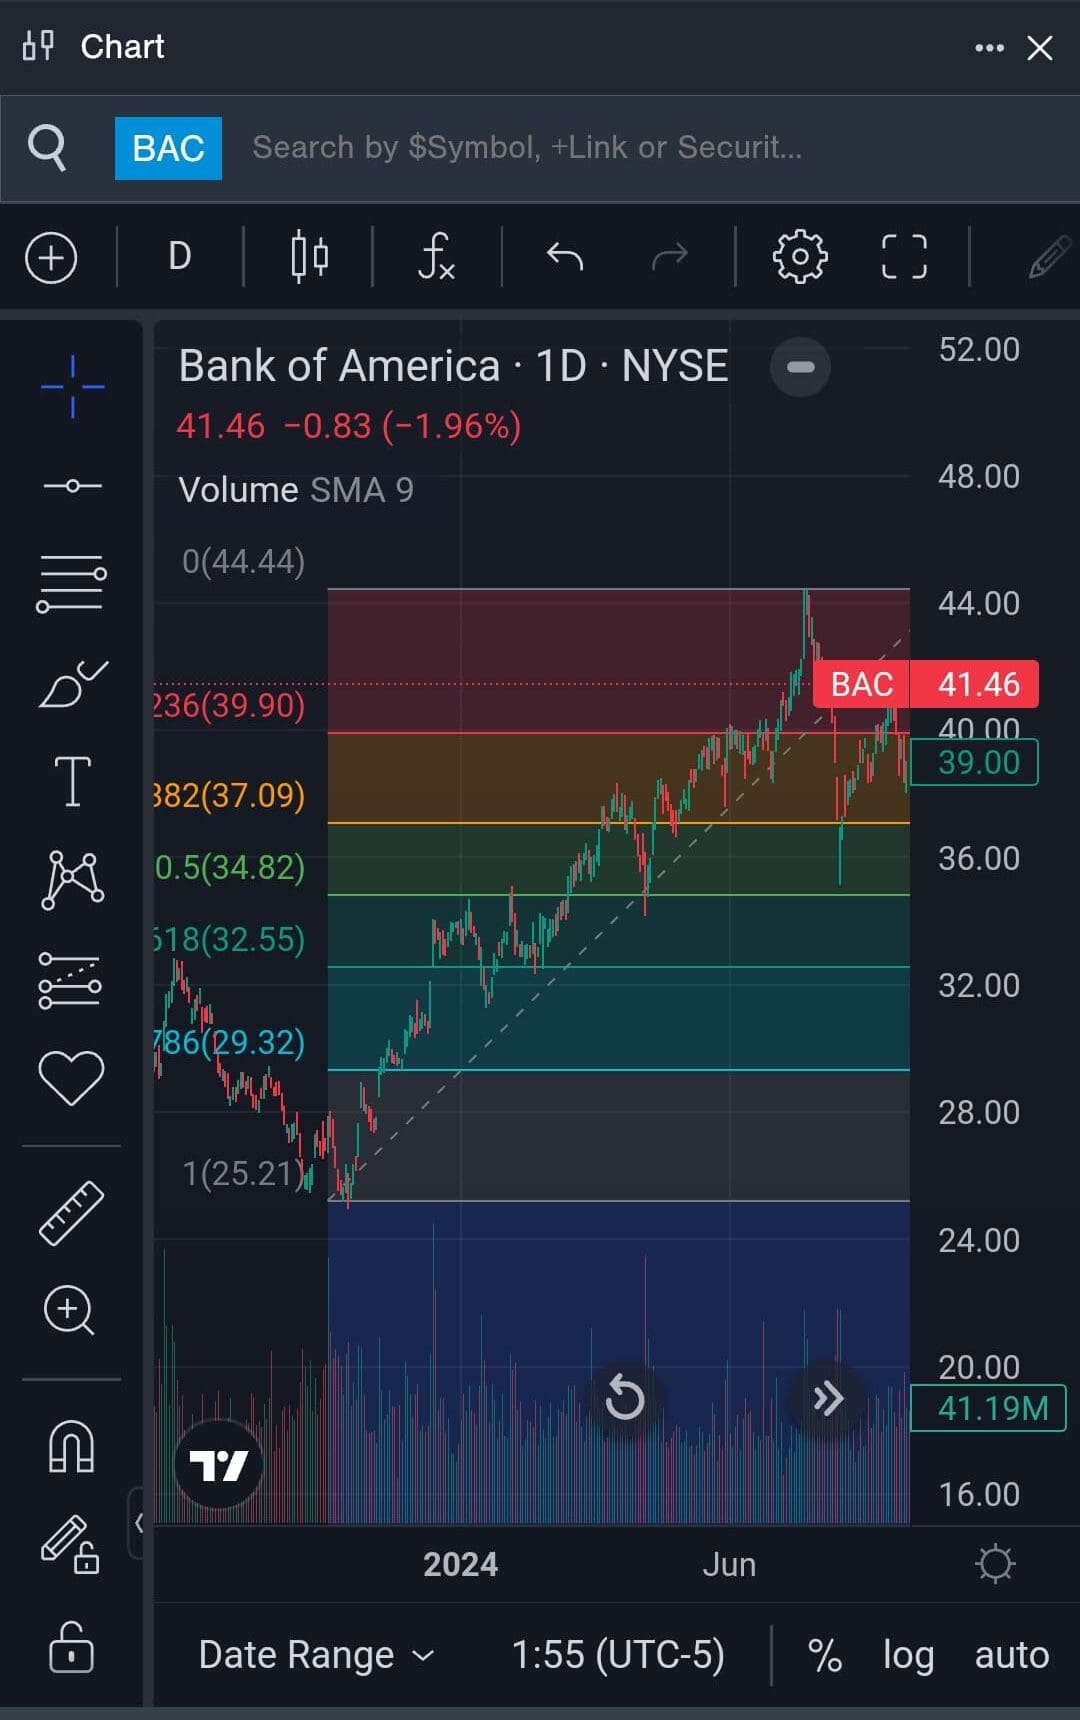
TradingView Premium is one of the best charting tools for traders, offering advanced customization, multi-timeframe analysis, and real-time data.
With Supercharts, traders can use up to eight charts per tab, apply 400+ indicators, and leverage tools like volume footprint, auto chart Patterns, and indicators on indicators.
The smooth, responsive interface, second-based alerts, and Pine Script® automation make it a go-to for technical traders.
Whether analyzing trends or building custom strategies, TradingView’s powerful charting capabilities set it apart.
- Supercharts & advanced charting
- Multi-timeframe & synced charts
- Indicators on indicators
- Auto chart patterns detection
- Second-based alerts & execution
- Webhook alerts & automation
- Premium stock & crypto screeners
- Expanded fundamental analysis
- Paper trading & trade simulation
- Social trading & script sharing
- Pine Script® strategy automation
- Dark & light mode themes
Plan | Monthly Subscription | Promotion |
---|---|---|
Trading View Essential | $14.95
$108 ($9 / month) if paid annually | 30-day free trial |
Trading View Plus | $29.95
$180 ($14.95 / month) if paid annually
| 30-day free trial |
Trading View Premium | $59.95
$432 ($23.98 / month) if paid annually | 30-day free trial |
Trading View Expert | $119.95
$1,199 ($99.95 / month) if paid annually | N/A |
Trading View Ultimate | $239.95
$2,399 ($199.95 / month) if paid annually | N/A |
Benzinga Pro
Subscription/month
Promotion
Our Rating
Best For
- Overview
- Features
- Pricing & Plans
- Platform Screenshots
Benzinga Pro earns its spot in our charting tools list thanks to its real-time stock charts, technical indicators, and intuitive interface.
The platform’s premium features, such as Nasdaq Basic real-time quotes and a full newsfeed, help traders make faster, more informed decisions. The combination of charting, live data, and expert insights makes it a strong option for active traders.
Besides charting tools, Benzinga Pro also provides real-time stock quotes, a full newsfeed, customizable watchlist alerts, and analyst ratings.
- Real-time stock quotes
- Full newsfeed access
- Watchlist alerts
- Technical stock charts
- Earnings reports updates
- Insider trading activity
- ETF data & trends
- Economic calendar
- Dividends & earnings data
- Stock movers tracking
- Premium research articles
- IPO calendar insights
Plan | Monthly Subscription | Promotion |
---|---|---|
Benzinga Pro – Basic | $37
$367 ($30.58 / month) if paid annually | 14-day free trial |
Benzinga Pro – Streamlined | $147
$1,497 ($124.75 / month) if paid annually | 14-day free trial |
Benzinga Pro – Essential | $197
$1,997 ($166.42 / month) if paid annually | 14-day free trial |
Benzinga Edge | $19
$228 if paid annually
| $129
$129 for new member’s annual price ($11/month), including 7-day money-back guarantee
|
Finviz
Monthly Subscription
Promotion
Our Rating
Best For
- Overview
- Features
- Pricing & Plans
- Platform Screenshots
Finviz made our list of top technical stock screeners because of its powerful filtering tools and easy-to-use interface.
The platform lets traders screen stocks based on technical indicators like moving averages, RSI, MACD, and Bollinger Bands, making it a great choice for spotting trends and momentum plays.
Beyond its charting tools, Finviz offers a powerful stock screener, real-time heatmaps, insider trading insights, and a curated news aggregator.
Its unique combination of technical and fundamental analysis tools helps traders quickly identify trends, track market sentiment, and uncover high-potential stocks.
- Elite stock screener
- Descriptive stock filters
- Fundamental stock filters
- Technical stock filters
- News & ETF screening
- Advanced stock charts
- Fundamental financial data
- Custom stock alerts
- Backtesting trading strategies
- Real-time stock quotes
- Stock correlations tool
- Insider trading insights
Plan | Annual Subscription | Promotion |
---|---|---|
Finviz Elite | $299.5 ($24.96 / month) | 30-day money-back guarantee |
StockCharts
Monthly Subscription
Promotion
Our Rating
Best For
- Overview
- Features
- Pricing & Plans
- Platform Screenshots
StockCharts earns a spot in our charting tools list because of its powerful technical analysis tools.
With SharpCharts for static, customizable charts and ACP (Advanced Charting Platform) for interactive, real-time charting, it offers flexibility for traders.
The 25+ indicators and overlays per chart, custom stock scanner, SCTR rankings, and market visualization tools like MarketCarpets and RRG Charts make it a solid choice for in-depth technical analysis.
The Premium plan unlocks full chart customization, more alerts, and unlimited saved scans, making it ideal for serious traders.
- SharpCharts static stock charts
- ACP interactive charting
- Stock screener & scanner
- 25 technical indicators
- Price & technical alerts
- Point & figure charts
- Relative Rotation Graphs
- Custom chart customization
- Sector & industry analysis
- Historical stock price data
- StockCharts TV commentary
- OptionsPlay trading tool
Plan | Monthly Subscription | Promotion |
---|---|---|
StockCharts Basic | $19.95 | 1-month free trial |
StockCharts Extra | $29.95 | 1-month free trial |
StockCharts Pro | $49.95 | 1-month free trial |
Yahoo Finance
Monthly Subscription
Promotion
Our Rating
Best For
- Overview
- Features
- Pricing & Plans
- Platform Screenshots
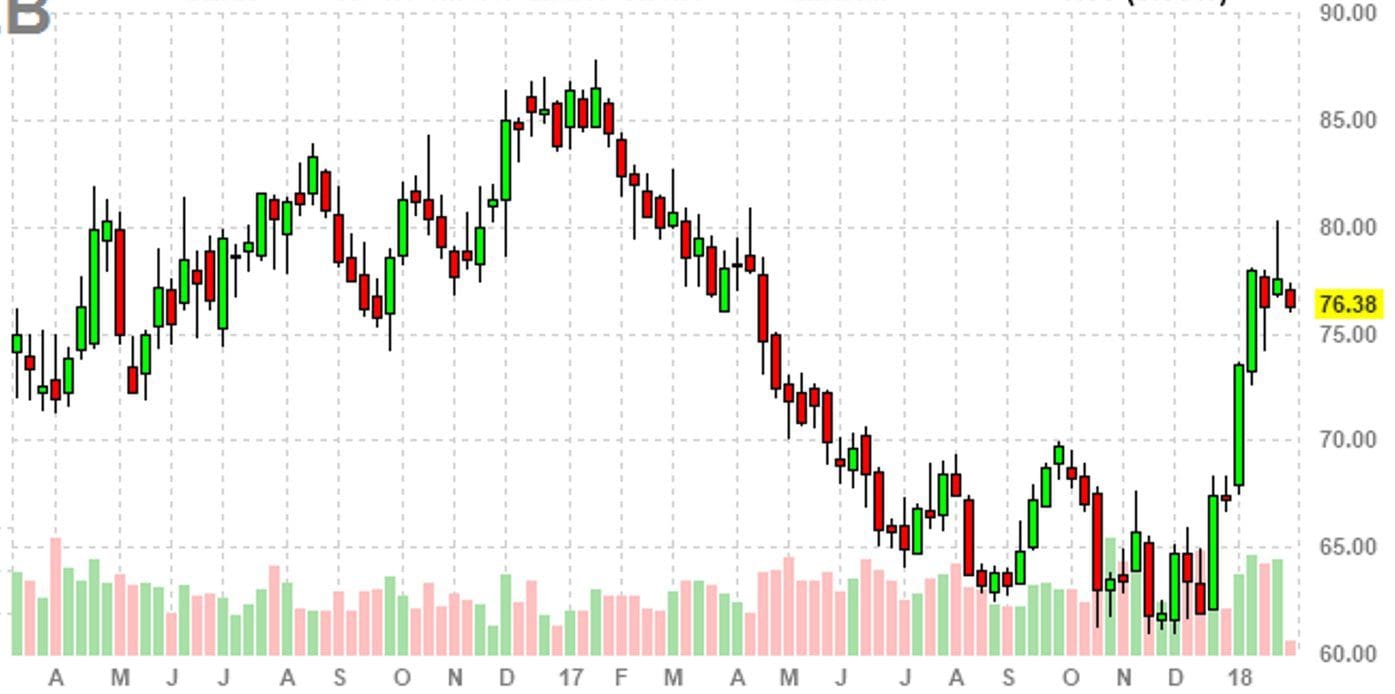
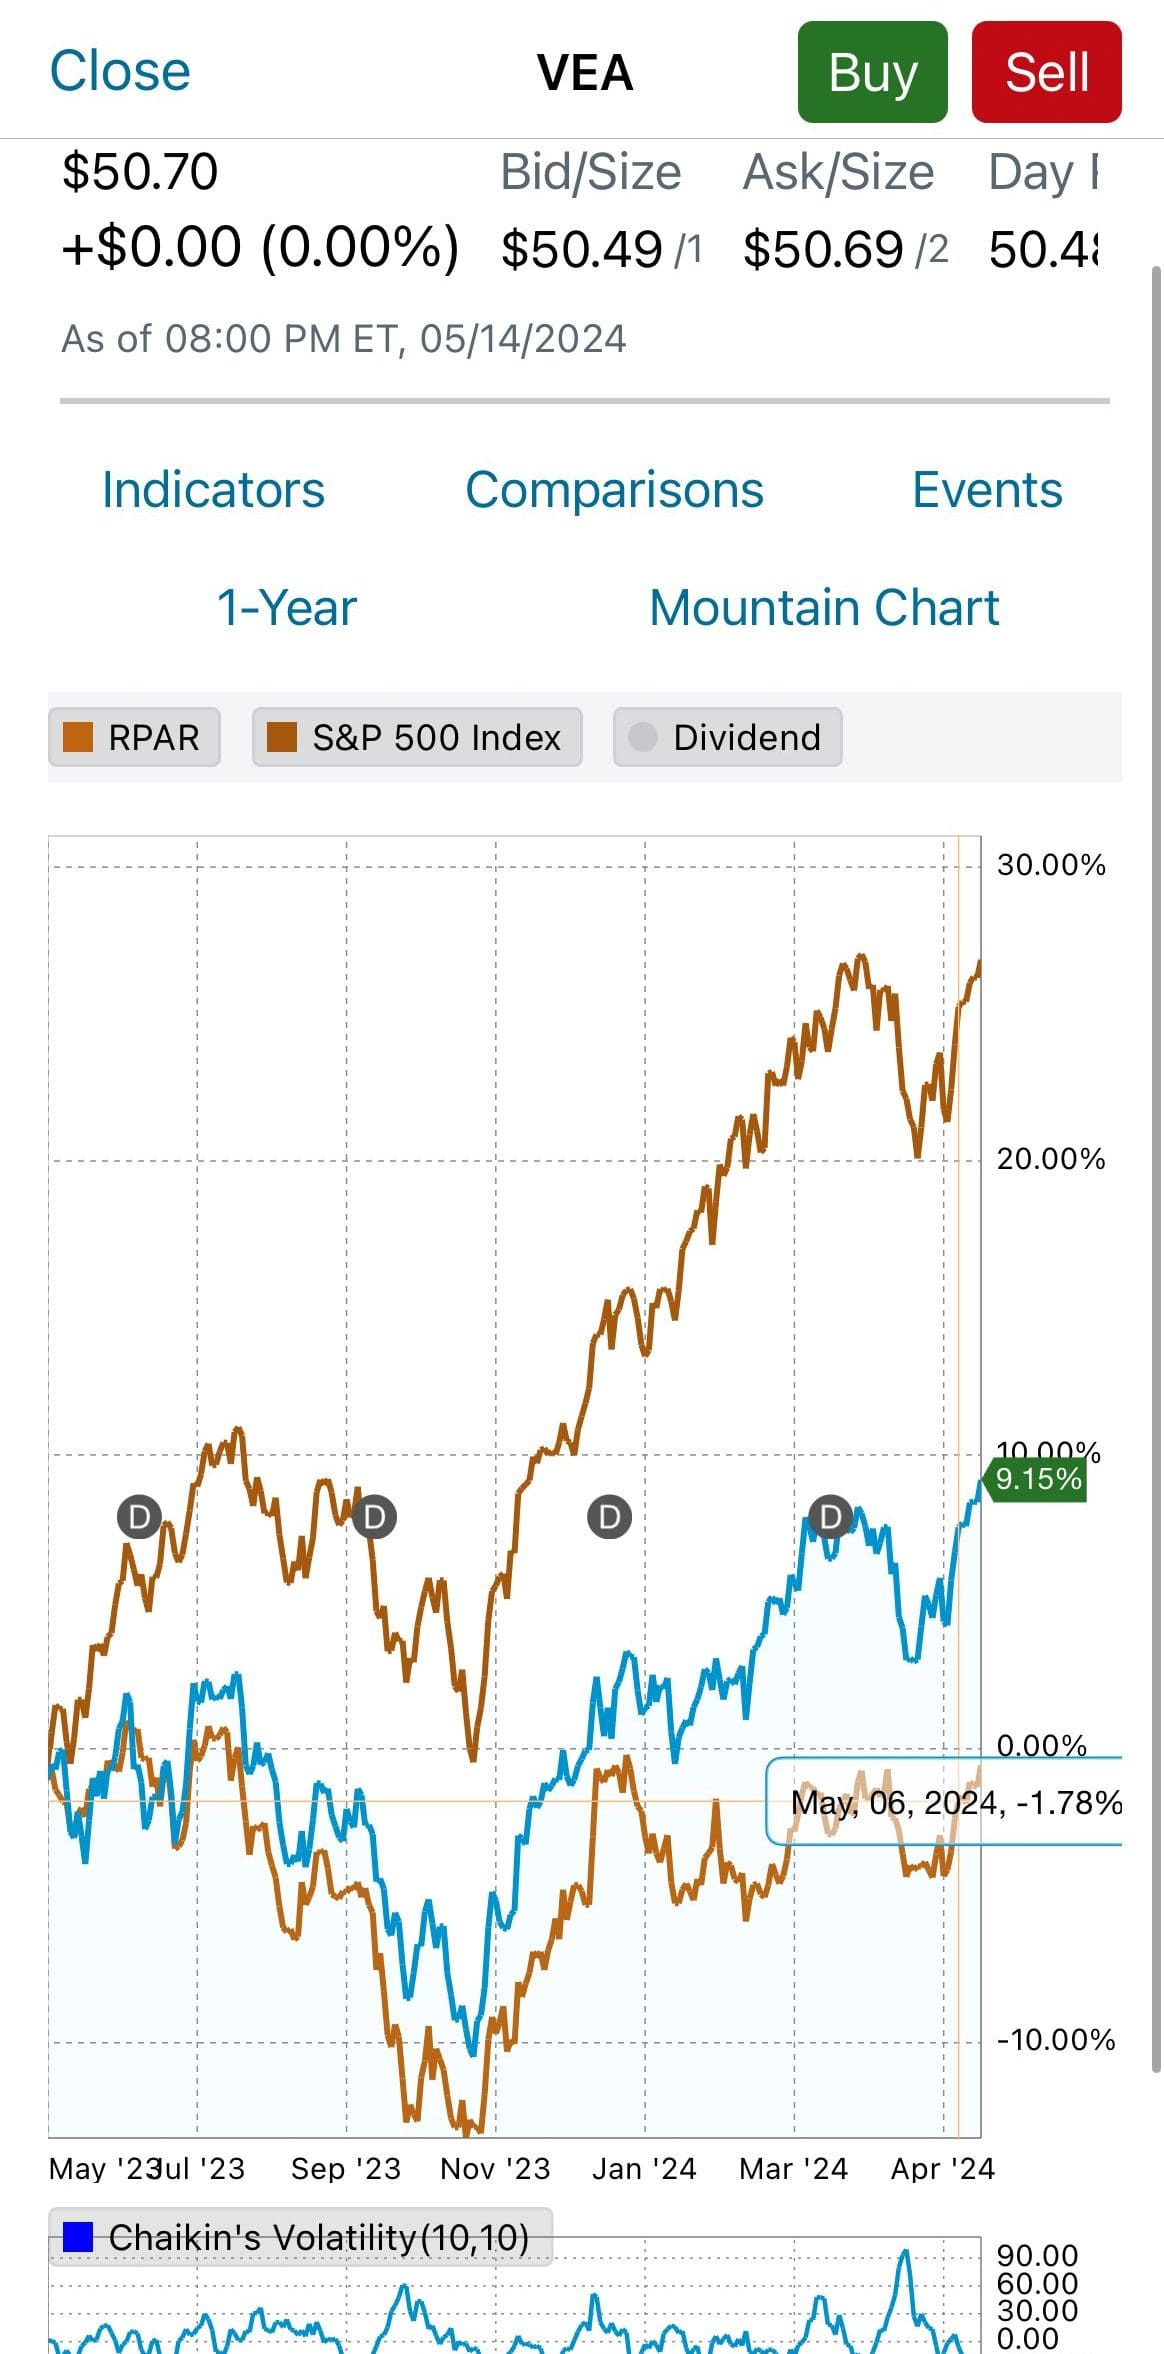
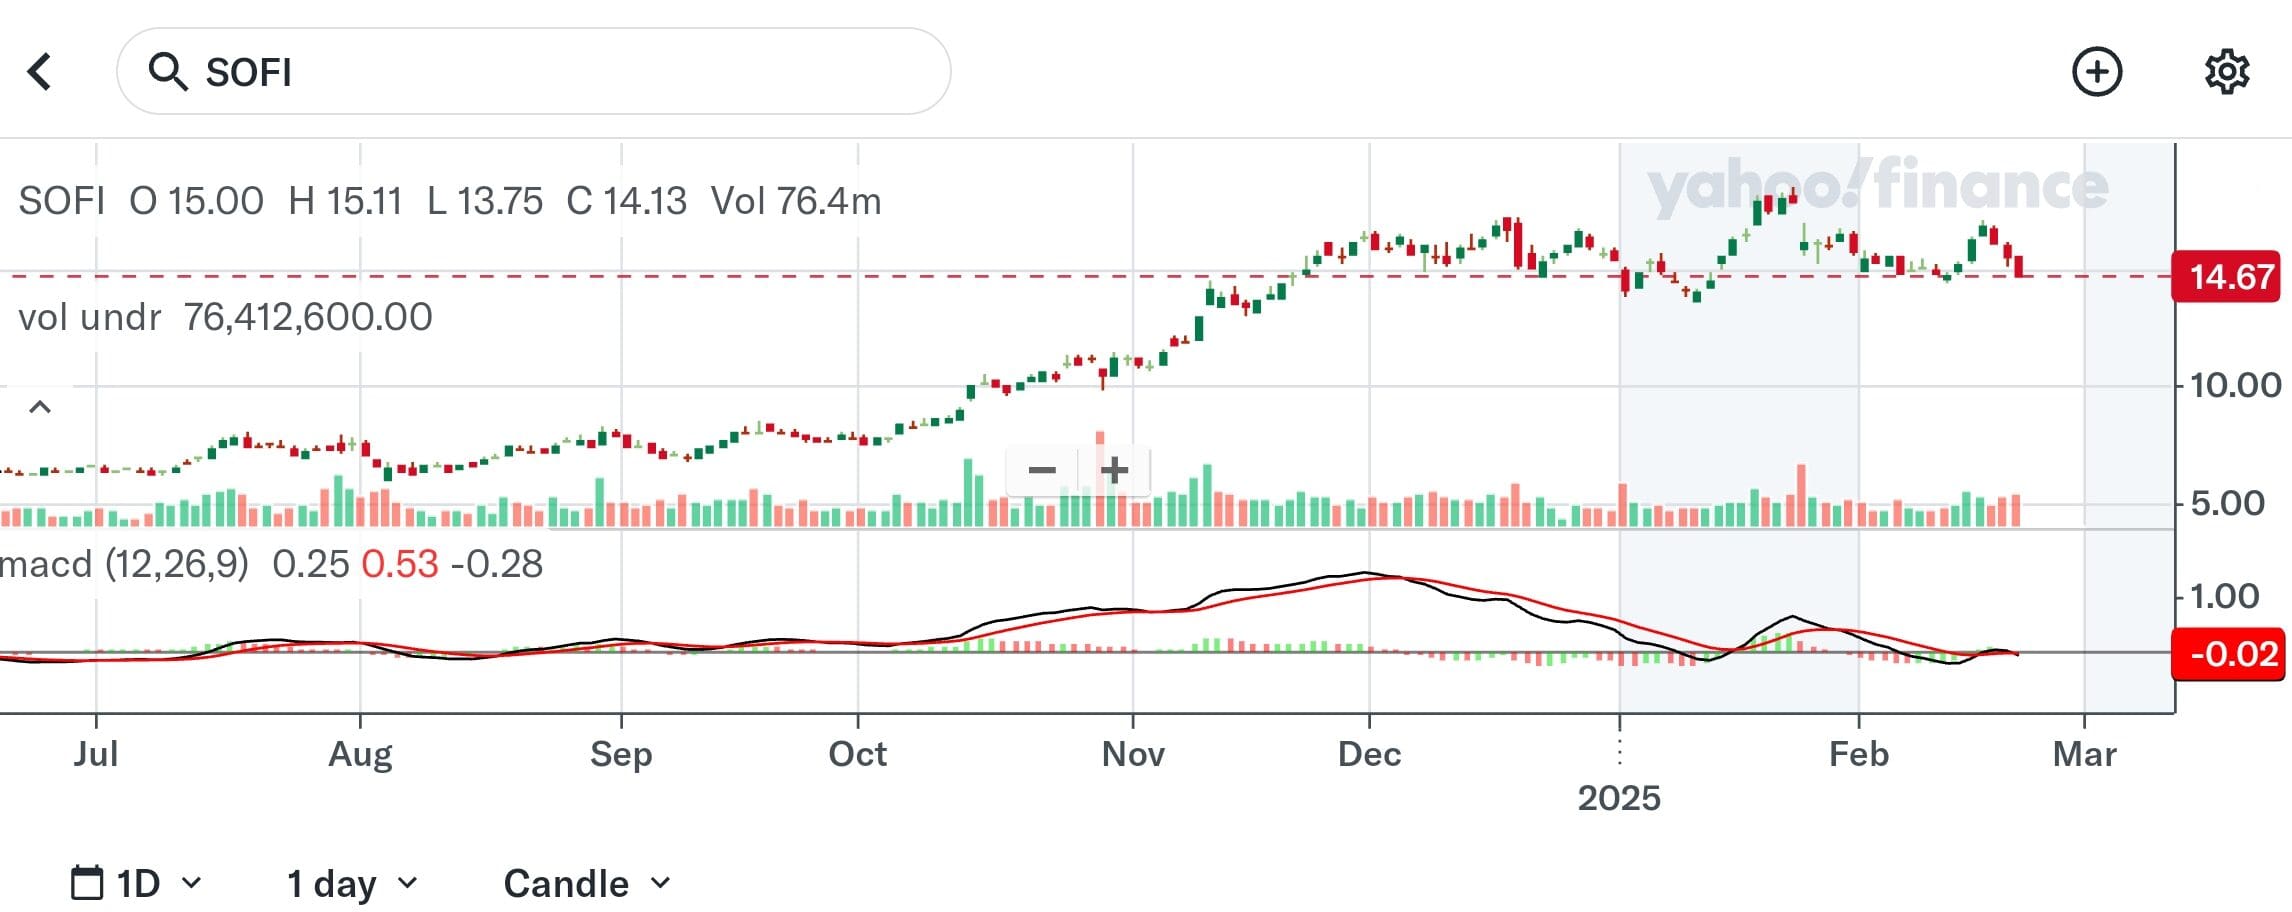
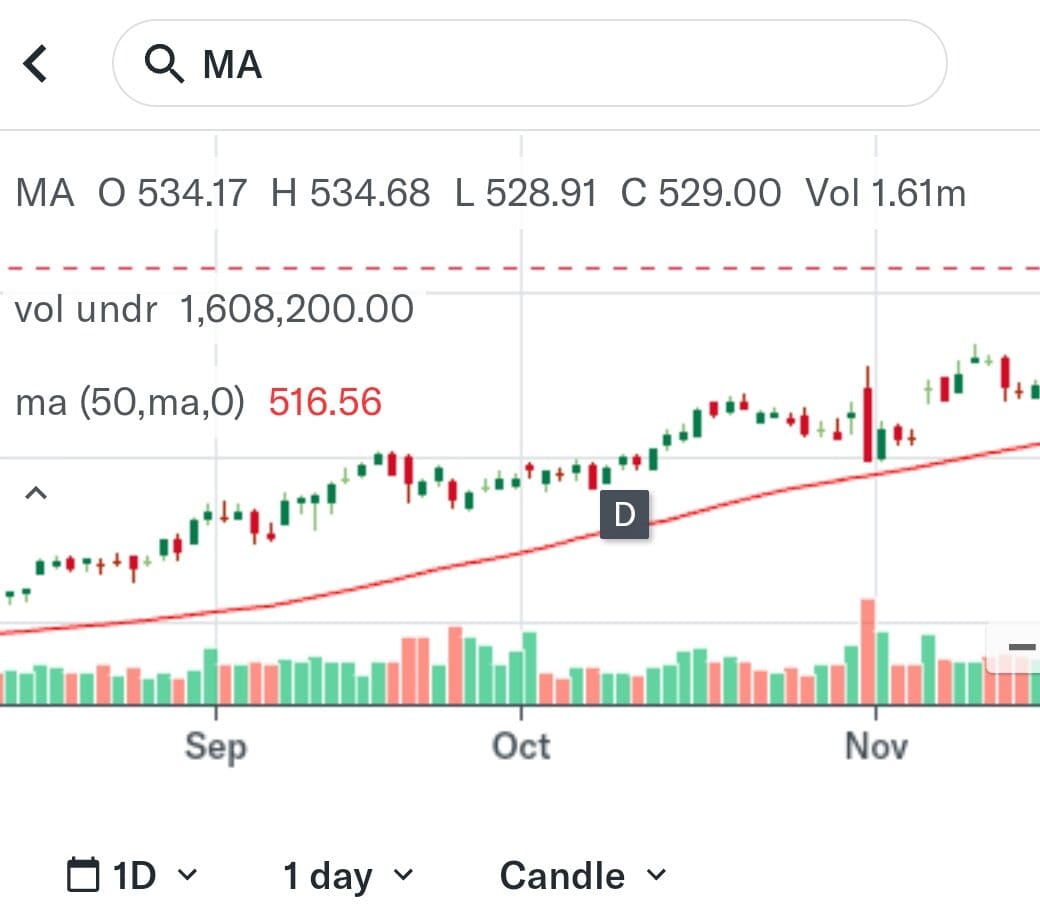
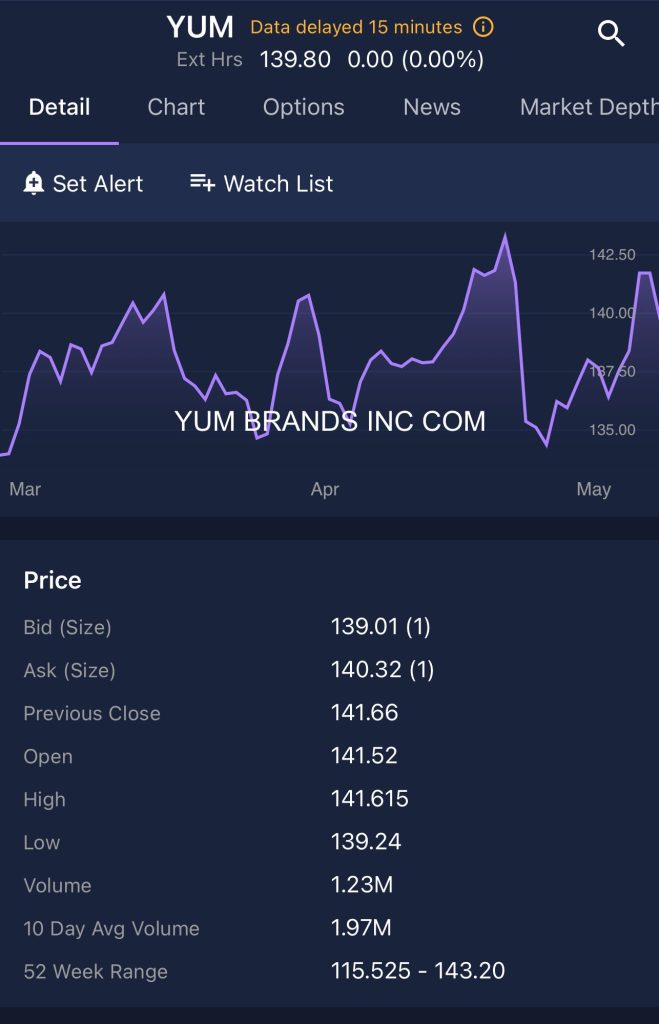
The Yahoo Finance charting tools offer a solid mix of technical indicators, historical data, and customizable stock charts, making them a valuable tool for traders.
We included it in our list because its premium features, such as 50+ technical patterns, chart event annotations, and smart money tracking, provide deeper insights for active traders.
Gold users benefit from technical pattern alerts and advanced charting, helping them identify breakouts, reversals, and key trading signals
- Personalized Trade Ideas
- 40 Years of Financial Data
- 50+ Technical Chart Patterns
- Smart Money Screener
- Analyst Ratings Screener
- Top Holdings Screener
- Technical Alerts & Annotations
- Morningstar & Argus Stock Ratings
- Stock & ETF Screener
- Portfolio Performance Analysis
- Insider Trading Insights
- Real-Time Stock Quotes
Plan | Monthly Subscription |
---|---|
Yahoo Finance – Bronze | $9.95
$95.40 ($7.95 / month) if paid annually |
Yahoo Finance – Silver | $24.95
$239.40 ($19.95 / month) if paid annually |
Yahoo Finance – Gold | $49.95
$479.40 ($39.95 / month) if paid annually |
Interactive Brokers
Monthly Fee
Minimum Deposit
Our Rating
APY Cash Account
-
Overview
- Platform Screenshots
Interactive Brokers earns its spot on our charting tools list thanks to its powerful, customizable charts and over 100 technical indicators, including RSI, MACD, and Bollinger Bands.
Traders can use advanced backtesting, pattern recognition, and multi-timeframe analysis to refine their strategies.
The premium charting tools in Trader Workstation (TWS) support deep technical analysis, making IBKR a top choice for active traders.
Besides Charting Tools, IBKR also offers access to 150+ global markets, low-cost trading, robust research tools, and algorithmic trading.
E*TRADE
Monthly Fee
Minimum Deposit
Our Rating
APY Cash Account
-
Overview
- Platform Screenshots
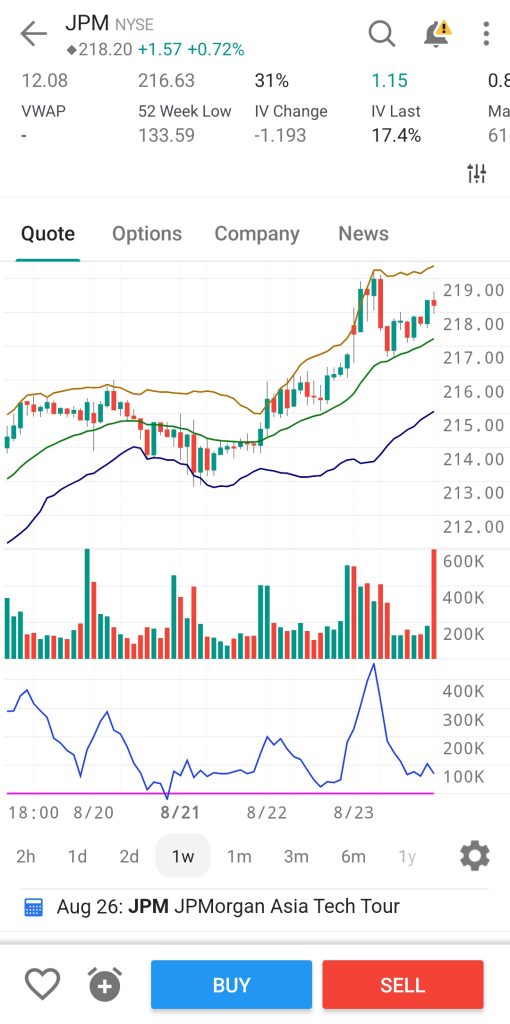
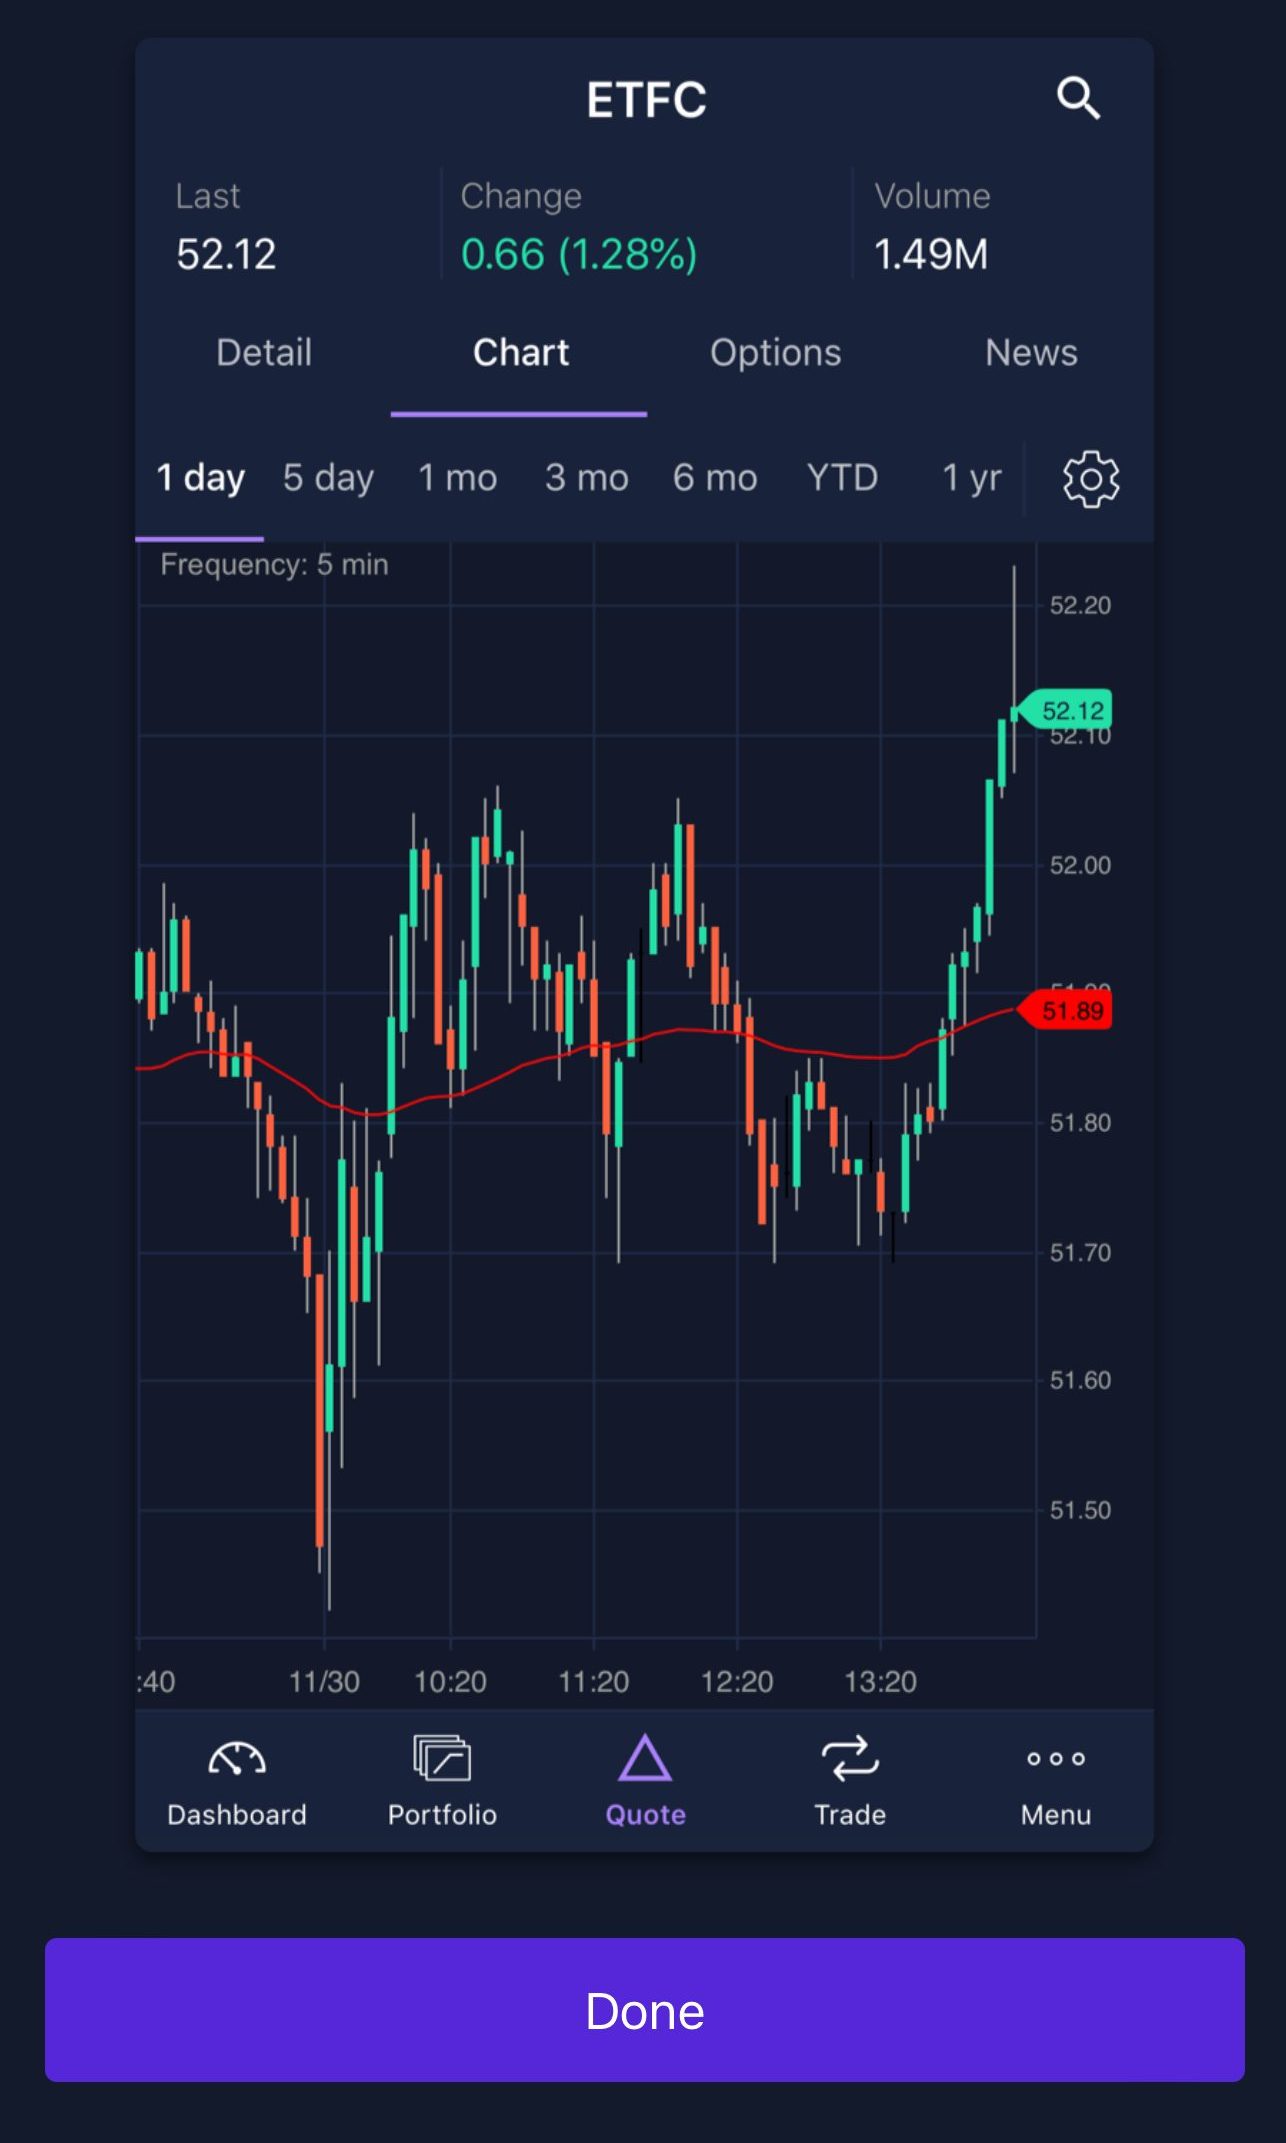
ETRADE earns its place on our list because of its Power ETRADE platform, which offers over 145 charting tools, technical studies, dynamic charts, and real-time data.
Traders can customize their charts, overlay indicators, and analyze market trends effortlessly.
Advanced features like risk-reward analysis, options strategies, and automated trendlines make it a strong choice for technical traders.
Besides Charting Tools, E*TRADE also provides commission-free stock and ETF trading, advanced options strategies, futures trading, research reports, and educational resources.
Charles Schwab
Monthly Fee
Minimum Deposit
Our Rating
APY Cash Account
-
Overview
- Platform Screenshots
Thinkorswim by Charles Schwab is a top pick for our charting tools for traders due to its advanced features like customizable charts, real-time market data, and technical indicators, making it ideal for active traders.
The platform's premium charting tools allow in-depth analysis with various studies, helping traders make informed decisions.
Thinkorswim offers multiple plans, including the basic version for all Schwab clients and a premium version with added services and personalized support.
From Data to Profits: The Power of Charting Tools in Trading
Charting tools are software or platforms that help traders visualize market data using price charts, technical indicators, and analytical tools.
These tools assist in identifying trends, patterns, and key price levels, enabling traders to make informed decisions.
For traders, charting tools are essential because they provide real-time data, historical price analysis, and predictive insights.
Features like candlestick charts, moving averages, and RSI (Relative Strength Index) help traders assess market momentum and potential entry or exit points.
Whether for day trading, swing trading, or long-term investing, charting tools enhance decision-making, reduce guesswork, and improve trading accuracy.
Key Features to Look for in a Trading Charting Tool
Choosing the right charting tool is crucial for traders looking to analyze price movements, identify trends, and make informed trading decisions. Here are the key features to consider:
- Real-Time Data & Market Feeds – A good charting tool should provide live price updates, ensuring traders react quickly to market movements without delays.
- Multiple Chart Types – Look for tools that offer various chart styles like candlestick, line, bar, and Heikin-Ashi to suit different trading strategies.
- Technical Indicators & Overlays – Essential indicators like Moving Averages, RSI, MACD, Bollinger Bands, and Fibonacci retracements help in technical analysis and decision-making.
- Drawing & Annotation Tools – Features like trendlines, support/resistance levels, and custom notes allow traders to mark key price action levels for better visualization.
- Customization & User Interface – A flexible and user-friendly interface with customizable themes, timeframes, and layouts enhances the trading experience.
- Backtesting & Historical Data – The ability to test strategies on past price movements helps traders refine their techniques and improve accuracy.
- Alerts & Notifications – Real-time price alerts via SMS, email, or push notifications ensure traders never miss important market events or trade signals.
- Multi-Device Accessibility – A good charting tool should work seamlessly across desktop, mobile, and web platforms for trading on the go.
A well-equipped charting tool gives traders a strategic edge, helping them analyze the market efficiently and execute trades with confidence.
7 Things Traders Can Do with a Charting Tool
Charting tools are essential for traders to analyze market trends, execute strategies, and make data-driven decisions.
Here are 7 key things traders can do with a powerful charting tool, along with real-world examples.
-
Analyze Price Trends
Traders can use charts to identify market trends—whether an asset is in an uptrend, downtrend, or sideways movement.
Example: A trader analyzing Apple (AAPL) stock on a daily chart might see an uptrend forming with higher highs and higher lows, indicating potential buying opportunities.
-
Apply Technical Indicators
Charting tools offer a variety of indicators like Moving Averages (MA), Relative Strength Index (RSI), and MACD to help traders assess market momentum.
Example: A forex trader using the MACD crossover on the EUR/USD pair can detect potential buy or sell signals based on trend reversals.
-
Identify Support & Resistance Levels
Support and resistance levels help traders predict where price movements might pause or reverse.
Example: A Bitcoin (BTC) trader might notice that BTC has struggled to break above $50,000 multiple times, signaling strong resistance at that level.
-
Draw Trendlines & Patterns
Charting tools allow traders to draw trendlines, triangles, head-and-shoulders patterns, and flag formations to recognize trade setups.
Example: A stock trader may spot an ascending triangle pattern on Tesla (TSLA), indicating a potential breakout to higher prices.
-
Backtest Trading Strategies
Traders can test their strategies on historical data before risking real money.
Example: A swing trader backtesting a moving average crossover strategy on the S&P 500 finds that using the 50-day and 200-day moving averages has historically yielded positive returns.
-
Set Price Alerts & Notifications
Many platforms allow traders to set real-time alerts for when a stock or asset reaches a certain price level.
Example: A crypto trader sets an alert for Ethereum (ETH) to notify them when the price drops to $3,000, allowing them to enter a buy position at a discount.
-
Trade Directly from the Chart
Some advanced charting platforms integrate with brokerage accounts, allowing traders to execute trades directly from their charts.
Example: A day trader using TradingView can place limit orders on Amazon (AMZN) stock right from the chart interface without switching platforms.
FAQ
Indicators like Moving Averages, RSI, MACD, and Bollinger Bands help traders identify momentum, trends, and potential reversals.
It should support candlestick, bar, line, Heikin-Ashi, and Renko charts for different analysis needs.
Key features include real-time data, multiple chart types, technical indicators, drawing tools, alerts, backtesting, and a user-friendly interface.
Traders use charting tools to identify market trends, spot trading opportunities, and analyze historical price movements for informed decision-making.
Alerts notify traders when a stock or asset reaches a predefined price level, helping them act quickly on opportunities.
Yes, investors use them to analyze long-term trends, support and resistance levels, and entry/exit points for stocks.
Backtesting allows traders to test strategies on historical data to see how they would have performed before applying them in live trading.