Finviz Free Plan
Monthly Subscription
Promotion
Our Rating
Best For
- Overview
- Features
- Pros & Cons
The Finviz Free Plan is a popular stock screening and market analysis tool designed for investors and traders who want fast, efficient stock research without paying for a subscription.
It offers delayed stock quotes (15–20 minutes), basic technical and fundamental stock screening, sector heatmaps, insider trading data, and a news aggregator that pulls updates from top financial sources.
The stock screener is one of the best free tools available, allowing users to filter stocks by valuation, performance, ownership, and technical indicators.
However, the plan has some limitations—it lacks real-time data, customizable charts, advanced screening filters, and alerts, making it less suitable for day traders, scalpers, and options traders.
- Stock screener filters
- Technical analysis tools
- Momentum stock filters
- Fundamental stock analysis
- Stock key financial data
- Basic charting tools
- Stock heatmaps
- News aggregator feed
- Insider trading data
- Portfolio tracking
- 3-year financial statements
- Futures & forex overview
- Free stock screener access
- Strong filtering options
- Comprehensive heatmap tool
- Includes insider trading data
- User-friendly interface
- No real-time data
- Limited interactive charting
- No alerts or notifications
- Only 3 years of data
- Limited technical indicators
How To Use Finviz Screener For Stock Research?
We tested Finviz's free plan – while the user interface is clean and easy to use, we found that its stock screener and market data offer great insights for investors.
-
Finviz Stock Screener
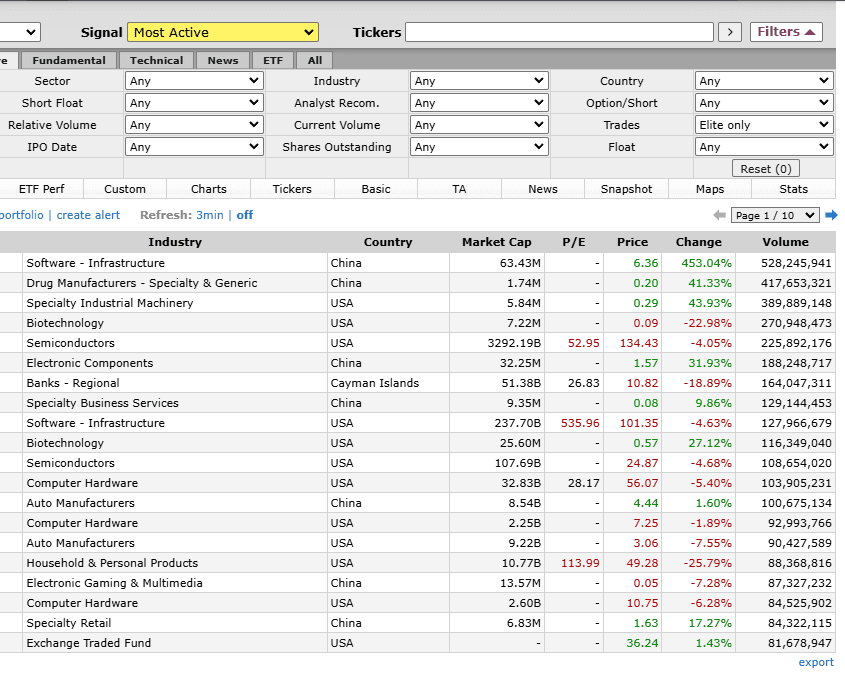
The stock screener is the heart of Finviz and one of the best stock free screeners available – even the free version offers a powerful set of filtering options.

When we tested it, we found that it helps traders and investors quickly identify trade opportunities by applying multiple filters, including valuation, performance, ownership, and technical signals, including a technical stock screener.
- Technical Analysis: Traders can screen stocks based on moving averages (SMA, EMA), RSI, MACD, Bollinger Bands, and candlestick patterns.
- Momentum & Breakout Trading: You can filter for stocks that have gained more than 5% in a day, hit new 52-week highs, or have unusual volume spikes.
- Fundamental Analysis: Investors can filter stocks based on key financial metrics such as P/E ratio, EPS growth, revenue growth, and debt/equity ratio
However, the free version has a 15-20 minute delay and it allows only 50 saved screeners, 20 stocks per page (table view), 36 stocks (chart view), and 10 stocks (snapshot view).
Despite its limitations, Finviz Free is one of the best free stock screeners available today.
-
Stock Key Financial Data
When we tested Finviz's stock key financial data, we found it to be a valuable feature for fundamental investors and stock advisors.
This section offers a comprehensive snapshot of a stock’s valuation metrics, profitability ratios, financials and institutional ownership. Here are the nice charts you can see under the financial section:
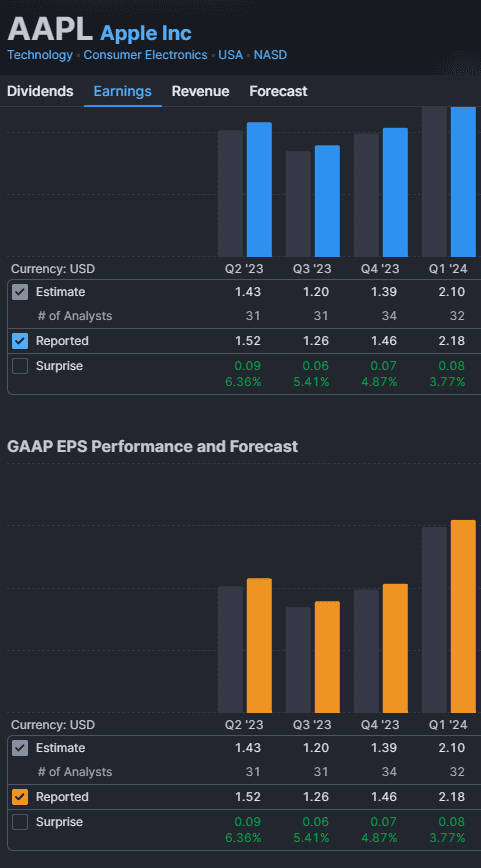
For traders, the volatility, beta, and short interest data is particularly useful. These metrics help assess risk levels and potential price swings, which can influence trading strategies and position sizing.

The main limitation of the free plan is that financial statements are only available for the past three years, whereas the Finviz Elite plan provides eight years of historical data.
-
Basic Charting
Finviz offers stock charts that are easy to read and packed with technical analysis tools, but in the free plan, they are delayed by 15–20 minutes and their capabilities are limited.
You can track performance based on different time ranges and apply technical features such as candlestocks, volume and lines. But, not much more than that.
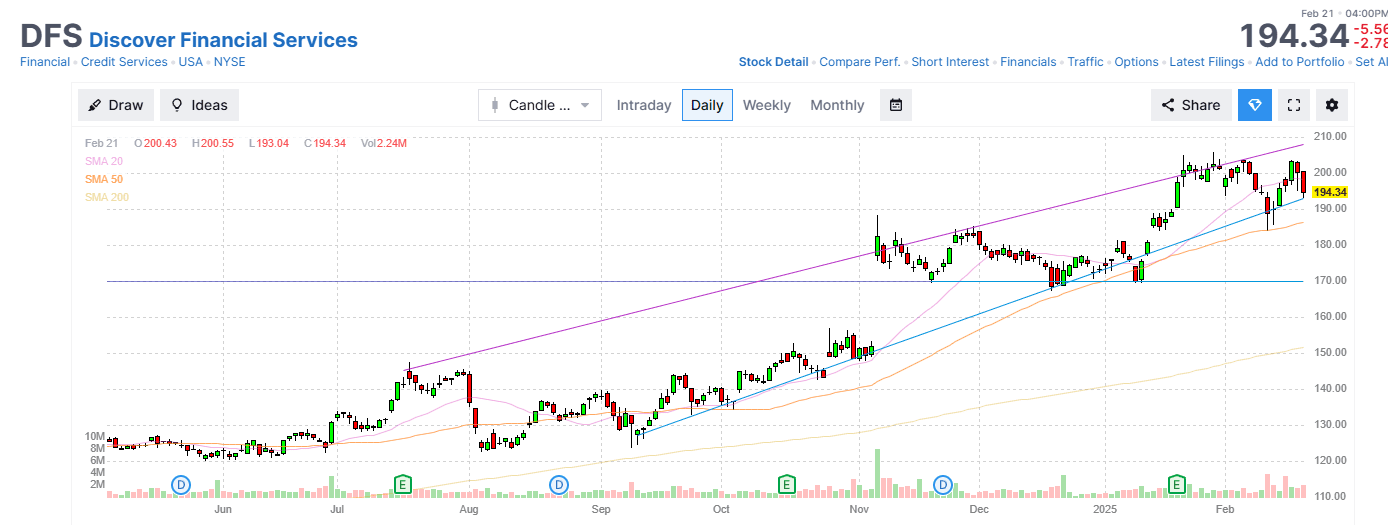
With the free plan, traders can't use various technical indicators, enlarge the chart, draw or make anything which is beyond the basics.
-
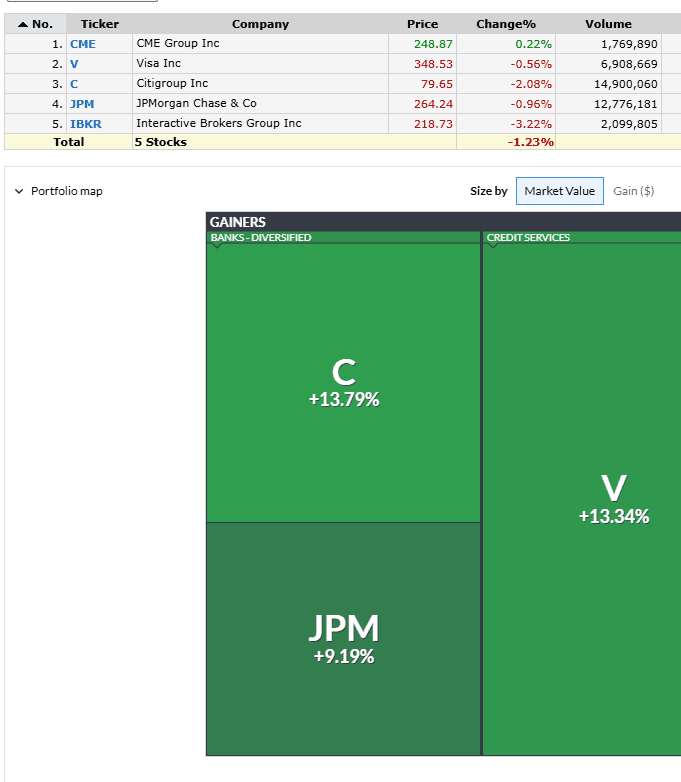
Stock Heatmaps
When we tested the Finviz Stock Heatmaps, we found it to be a powerful visual tool for tracking market trends at a glance.
The heatmap provides an instant overview of which stocks, sectors, and industries are performing well (green) or struggling (red).
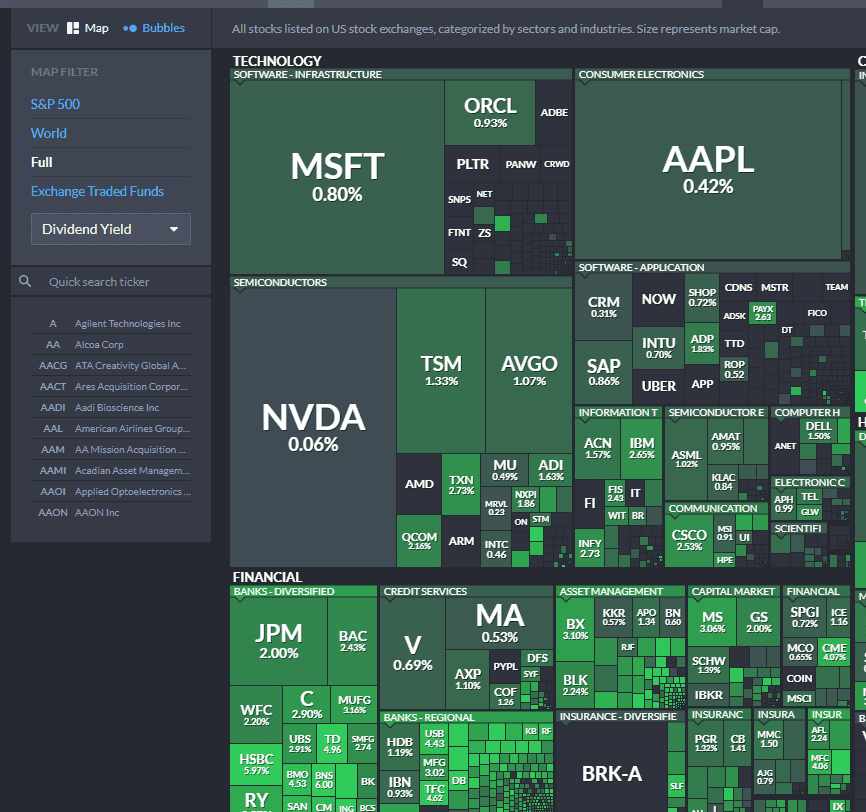
For long-term investors and swing traders, the heatmap remains useful. You can analyze sector trends, compare market-wide movements, and refine your stock analysis.
Investors and traders can use this feature to spot sector rotations—for example, if technology stocks are all red while energy stocks are green, it may indicate a shift in investor sentiment.
Market Data & Additional Features In Finviz Free Plan
Finviz's free plan offers relevant market data as well as other tools for investors:
-
News Aggregator
One of the most underrated features in the Finviz Free Plan is the News Aggregator.
When we tested it, we found it to be a one-stop hub for stock market news, pulling in updates from top financial news sources like CNBC, Bloomberg, MarketWatch, and Reuters.

Investors and traders can filter between general market news, stock news, ETF news and even crypto news.
Traders and investors can stay informed on company earnings, analyst ratings, insider transactions, and market-moving headlines without jumping between different news sites.
-
Insider Trading Data
We tested Finviz’s Insider Trading feature and found it surprisingly useful for tracking smart money moves.
This tool compiles insider buying and selling activity, allowing investors to see if CEOs, CFOs, or major shareholders are loading up on stock—or dumping it.
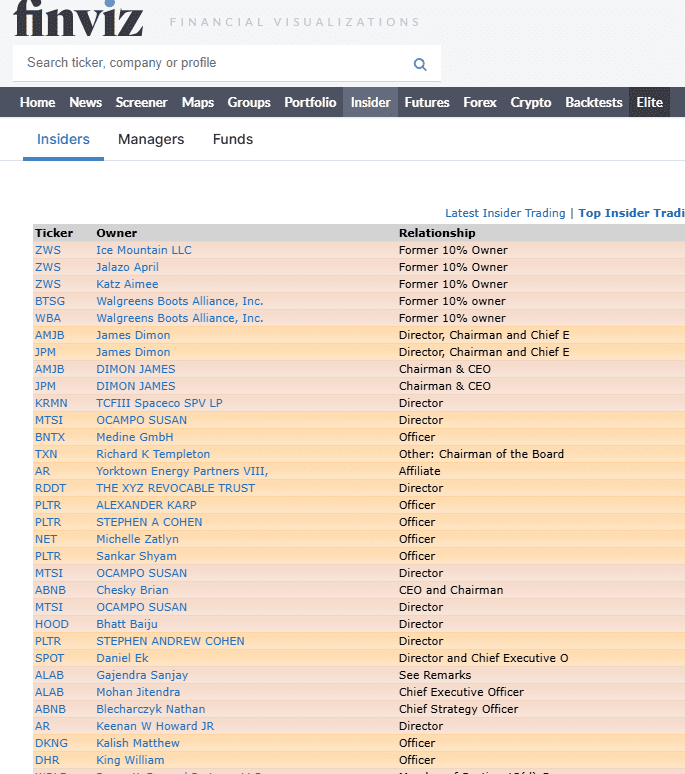
Investors and traders can filter between latest insider trading, top insider trading recent week and top 10% owner trading recent week.
The main downside? No alerts or real-time tracking in the free plan. Investors must manually check for updates, and traders who rely on real-time insider moves for quick trades may find this frustrating.
-
Portfolio Tracking
The Finviz Free Plan allows users to create and track up to 50 portfolios, each with a maximum of 50 stocks.
We tested this feature and found it useful for managing multiple investment strategies. You can set up portfolios and include a number of shares, average cost, total cost, dates, and more.
The good news? It’s easy to use and provides a quick overview of stock performance, including price changes and changes you've made, including specific dates and prices.
The bad news? No real-time updates. Stock quotes are delayed, which means you can’t rely on Finviz for real-time portfolio tracking.
-
3 Year Financial Statements
One of the biggest advantages of Finviz’s Free Plan is access to company financial statements for the past three years.
We reviewed this feature and found that it’s great for fundamental analysis, allowing investors to assess revenue growth, profitability, and balance sheet health.
With just a few clicks, you can analyze key financial metrics like earnings per share (EPS), revenue, debt levels, and cash flow.
The drawback? Three years of data is limited, especially if you want to study long-term trends or economic cycles.
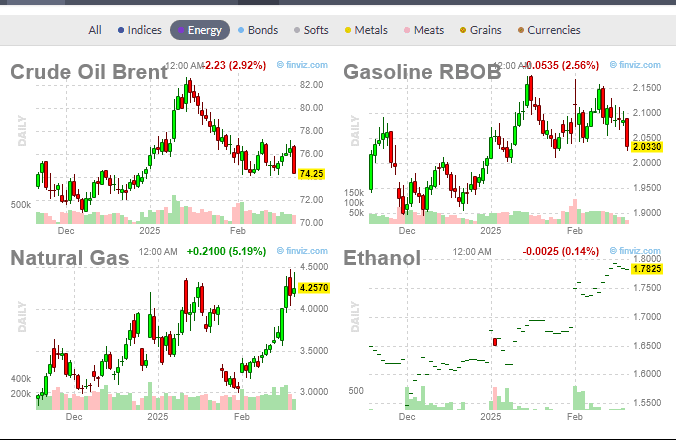
Additional Features & Tools
Finviz Free Plan offers a variety of tools beyond its core stock screener and charting features. Here are additional useful tools available in the free version:
Futures & Commodities Overview: Provides a snapshot of major stock index futures (S&P 500, NASDAQ, Dow), commodities (gold, oil, silver), and currency pairs, helping investors gauge premarket sentiment and macroeconomic trends.
Forex Market Data: Tracks major currency pairs like EUR/USD, GBP/USD, and USD/JPY, giving forex traders insights into market movements and potential trade setups.
Options Data (Limited): Displays basic option data such as open interest and implied volatility, offering a quick look at market sentiment in options trading.
Limitations: Who Finviz Free Isn’t For
While Finviz Free offers a solid set of tools for stock screening and market analysis, it has some notable limitations that can impact active traders and serious investors:
-
No Real-Time Data
One of the biggest drawbacks of Finviz Free is its delayed stock quotes and charts (15–20 minutes late). While this might not be a dealbreaker for long-term investors, day traders and scalpers who rely on instant price movements will find this frustrating.
Other platforms, like Yahoo Finance and Benzinga, offer real-time stock charts and live market data in their free versions.
-
Limited Interactive Charts & Technical Analysis
While Finviz provides basic stock charts with auto-detected trend lines, the free plan lacks interactive charting features.
Users can’t use more than few indicators and can't customize indicators, add multiple overlays, or adjust timeframes in detail.
-
No Alerts or Notifications
Finviz Free doesn’t provide real-time alerts for price movements, news, insider trading, or earnings updates. This means traders must constantly check the platform to stay updated.
In contrast, MarketBeat and TradingView allow custom price alerts and news notifications even in their free plans.
Who Gains the Most from Finviz?
Who Is Finviz Free a Good Fit For?
Finviz Free is a great tool for traders and investors who don’t need real-time data but still want a powerful stock screener and market analysis tools. Here’s who can benefit most:
Long-Term Investors: The financial data, earnings reports, and valuation metrics help identify solid investment opportunities for buy-and-hold strategies.
Beginner Traders: The simple interface and preset screeners make it easy to explore the market without in depth charting tools.
Sector & Market Researchers: The heatmaps, performance groups, and correlation tools provide a broad market overview, helping investors track trends.
Why Finviz Free May Not Work for You
While Finviz Free is useful for many traders and investors, it has limitations that might make it a poor choice for certain strategies. Here’s who may not find it suitable:
Day Traders: The 15–20 minute data delay is a major drawback for those who need real-time quotes, fast-moving charts, and instant execution.
Options Traders: The free plan provides only basic options data, lacking key insights like implied volatility, Greeks, and open interest trends.
Investors Needing Deep Fundamental Research: Only three years of financial data is available, whereas competitors like Stock Rover and Morningstar offer more historical insights.
Finviz Free vs Elite: Worth To Upgrade?
Finviz offers two main plans: Finviz Free and Finviz Elite (Premium). While the Finviz Free plan is entirely costless but comes with limitations.
Upgrading to Finviz Elite depends on how actively you trade and what features you need.
Plan | Subscription | Promotion |
|---|---|---|
Finviz Elite | $39.50
$299.5 ($24.96 / month) if paid annually | 30-day money-back guarantee |
Who May Consider Upgrade to Finviz Elite?
- Active traders & swing traders who need real-time data, intraday charts, and live news.
- Investors who rely on advanced screeners, custom alerts, and backtesting.
- Traders looking to track pre-market & after-hours movements.
- Those who value custom notifications and hedge fund tracking.
FAQ
No, Finviz does not have a dedicated mobile app, but the website is mobile-friendly and can be accessed through a browser on any smartphone or tablet.
No, Finviz does not offer crypto screening. It focuses on stocks, ETFs, forex, and futures, so traders looking for crypto analysis will need alternative platforms.
Yes, you can filter for low-priced stocks by setting price ranges, but there are no real-time quotes or advanced filters tailored specifically for penny stock trading.
Yes, it provides ETF data, including performance, volume, and holdings, but ETF screening options are limited compared to dedicated ETF platforms.
No, only the Finviz Elite plan provides real-time premarket and after-hours stock data. The free version updates only during regular market hours.
No, backtesting tools are available only in Finviz Elite. The free plan does not support historical testing of technical indicators or trading strategies.
Yes, the platform shows analyst upgrades, downgrades, and price targets, but updates are delayed and not as detailed as platforms like MarketBeat or TipRanks.
No, the data export feature (Excel, CSV) is only available in the Finviz Elite plan, making it difficult for free users to analyze stocks offline.
Review Free Stock Analysis Tools


Investment Analysis & Research Tools : Review Methodology
At The Smart Investor, we evaluated free investment research platforms based on the quality and depth of their features compared to other free alternatives. Each platform was rated based on the following criteria:
- Fundamental Analysis Tools (25%): We assessed the availability of key financial data, including income statements, balance sheets, cash flow, valuation metrics, and analyst estimates. Platforms with more in-depth historical data, forward-looking projections, and research reports scored higher.
- Technical Analysis Features (20%): We examined the variety and quality of technical indicators, charting tools, and real-time price data. Platforms that offered customizable interactive charts, trend analysis, and multiple timeframes received better ratings.
- Stock Screener & Free Filters (15%): A strong stock screener is crucial for research, so we rated platforms based on the number and depth of filtering options. Higher scores were given to platforms that allowed customized searches using fundamental, technical, and sector-based criteria.
- Portfolio Tracking & Alerts (15%): We reviewed the ability to track multiple portfolios, set up watchlists, and receive alerts on stock movements. Platforms offering real-time updates, dividend tracking, and personalized notifications ranked higher.
- Ease of Use & User Experience (15%): Platforms were rated on their design, navigation, and accessibility across devices. Those with intuitive layouts, easy-to-read data, and smooth user experiences received better scores.
- Additional Perks & Limitations (5%): We considered unique tools, premium research access, and potential feature restrictions. Platforms with added perks like AI analysis or fewer paywalls scored higher, while those with aggressive ads or major limitations were rated lower.
- Community & Social Features (5%): Platforms with investor discussion forums, sentiment tracking, or social trading features were rated higher. Those lacking community-driven insights or engagement tools scored lower.
