What Is MarketBeat?
MarketBeat is one of the best free stock analysis and research platforms. It helps investors track analyst forecasts, insider activity, dividends, earnings, and portfolio performance—all from a beginner-friendly interface.
Its free plan includes analyst rating summaries, a basic stock screener, insider trade tracking, short interest data, and portfolio monitoring tools.
While the free version lacks an ETF screener, advanced technical charts, or real-time news, MarketBeat offers enough features to support long-term investors, dividend seekers, and anyone building a research-backed portfolio.
For those considering a MarketBeat subscription, MarketBeat All Access offers a robust upgrade.
How to Use MarketBeat Stock Analysis Tools
MarketBeat combines research data, financial insights, and portfolio tools to help investors make more informed decisions. Here's how to get the most out of its free stock analysis tools:
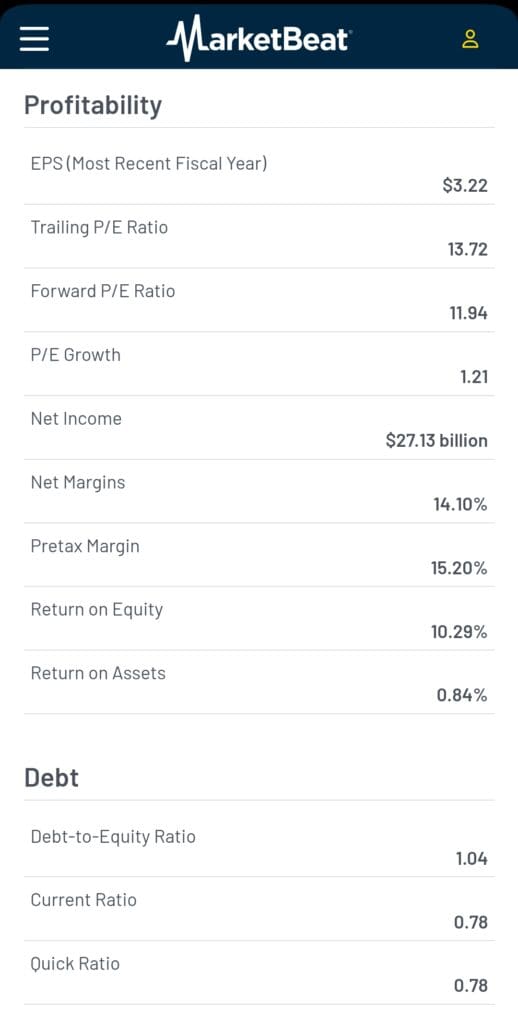
1. Explore Company Fundamentals with Financial Overviews
MarketBeat’s financial data tools give investors a quick way to evaluate a company’s strength across revenue, debt, margins, and profitability.
Access summaries of income statements, balance sheets, and cash flow data to understand how a business generates and manages capital.
Track key ratios like gross margin, net margin, debt/equity, and revenue growth—essential for assessing a company’s financial trajectory.
Use past performance metrics to evaluate consistency and volatility in earnings, which can help identify stable vs speculative stocks.
2. Evaluate Dividend Strength for Long-Term Yield Strategies
For income investors, MarketBeat provides robust dividend data to help assess the sustainability and reliability of payouts.
View dividend yield, payout ratio, and frequency, helping you estimate annual income from each stock.
See ex-dividend and payment dates, which are key for timing purchases to qualify for upcoming distributions.
Compare dividend consistency and growth history, so you can identify dividend aristocrats vs. riskier high-yield plays.

3. Review Financial Statements for Deeper Fundamental Analysis
For investors focused on balance sheet health and income growth, MarketBeat provides easy access to core financials.
Access income statements, balance sheets, and cash flow summaries to evaluate profitability, debt, and capital usage.
Use net income, EPS, and cash position trends to assess financial health over time.
Scan revenue growth and margin changes to identify improving fundamentals or signs of weakness.

-
Example & Tip
For example, you're evaluating two small-cap stocks. One shows strong revenue growth but negative cash flow. MarketBeat’s cash flow statement highlights high CapEx—a red flag for near-term cash burn risk.
4. Analyze Analyst Ratings for Market Insight
MarketBeat’s analyst ratings dashboard helps you gauge institutional sentiment and consensus expectations for any stock.
Track upgrades, downgrades, and re-ratings in one place to understand shifts in analyst outlook—perfect for spotting momentum before broader market reactions.
See consensus price targets and rating trends (Buy/Hold/Sell) over time to identify bullish or bearish shifts.
Compare analyst sentiment across multiple stocks using the stock comparison tool to decide where confidence is strongest.

-
Example & Tip
For example, you're researching Amazon (AMZN). MarketBeat shows a cluster of upgrades with rising price targets after its earnings report.
This may signal institutional confidence—especially if paired with rising volume.
5. Use Insider Trade Tracking for Hidden Signals
Insider trading activity often reflects real views from company executives. MarketBeat helps you spot these actions quickly.
Monitor recent insider buys and sells, including dollar amounts and names of executives, to understand confidence levels.
View historical insider patterns—repeated buying can indicate bullish internal expectations.
Combine insider moves with earnings timing to detect possible signals of future performance surprises.

6. Use the MarketBeat Stock Screener to Find New Ideas
MarketBeat’s screener allows free users to filter stocks by valuation, sentiment, and performance—all from a clear, easy-to-use interface.
Search stocks by analyst ratings, revenue growth, or dividend yield, ideal for growth and income strategies.
Include filters like short interest or insider buying to spot contrarian or momentum plays.
Save screener results and compare ideas using the stock comparison tool to evaluate side-by-side performance.
7. Monitor Your Portfolio with My MarketBeat Tools
My MarketBeat lets you build and monitor a portfolio for free, complete with alerts and insights into performance and risk.
Track stock price changes, analyst rating shifts, and dividend announcements—all sent to your inbox.
View risk metrics, returns, and allocation breakdowns to understand where your exposure lies.
Compare your portfolio to MarketBeat’s user base to identify overweights or missing sectors.

8. Compare Stocks Side by Side to Spot Leaders
MarketBeat’s Stock Comparison Tool makes it easy to analyze multiple stocks across valuation, analyst sentiment, and performance metrics—all in one place.
Compare up to 10 stocks simultaneously, reviewing price changes, market cap, dividend yields, earnings history, and technical indicators.
Evaluate which stocks analysts favor most, with clear Buy/Hold/Sell breakdowns and target prices across all selected tickers.
Check profitability, valuation, and balance sheet data to spot the financially stronger company when choosing between similar names.

9. Follow Short Interest Trends to Gauge Market Sentiment
Short interest can reveal how bearish—or contrarian—a stock’s sentiment is. MarketBeat’s short interest tracking tool helps you detect these signals quickly.
View the percentage of shares sold short over time to gauge how bearish the market is on a particular stock.
Watch for rapid declines in short interest, which may signal short covering or a potential rally setup.
Use short interest trends with earnings data to assess the risk of short squeezes or sentiment reversals.
10. Use Options Chain Data to Understand Market Positioning
While limited in depth, MarketBeat’s options chain gives a snapshot of how traders are positioning themselves around key expiration dates.
See open interest and volume for calls and puts by strike price to identify where the market expects big moves.
Analyze bid/ask spreads and near-the-money strikes to gauge liquidity and possible short-term trade targets.
Check expiration dates tied to earnings or market events, giving context to trader sentiment around volatility.
FAQ
Yes, you can create and manage multiple portfolios within MarketBeat's free plan using the “My MarketBeat” tool. Each portfolio can have its own alerts and insights, which helps if you're tracking different strategies or account types.
MarketBeat lets you receive email alerts for major events like analyst upgrades, earnings announcements, or insider trades. While SMS alerts are only available in the premium version, email alerts cover most key updates.
MarketBeat aggregates ratings from multiple analysts but doesn’t rate the analysts themselves on the free plan. The premium version includes performance scores, helping you identify the most reliable analysts over time.
Yes, MarketBeat’s screener includes filters for valuation metrics like P/E ratios and revenue growth. You can use these tools to screen specifically for undervalued value stocks or high-growth opportunities.
Once you’ve added stocks to your portfolio, MarketBeat’s daily newsletter and alerts will prioritize updates on those companies. This keeps you focused on relevant headlines without needing to search manually.
MarketBeat offers multi-year views of earnings, dividend history, and some financial statement data. While it’s not as detailed as premium platforms, it provides enough to spot key trends like revenue growth or declining margins.
The free version does not support ETF or mutual fund screening. ETF research is only available with the MarketBeat All Access plan, making the platform more stock-focused for free users.
The Stock Comparison Tool lets you select multiple companies and compare key metrics side by side. This is useful when choosing between sector leaders or narrowing down a shortlist in a specific industry.
