TradingView Essential Plan
Monthly Subscription
Promotion
Our Rating
Best For
- Overview
- Features
- Pros & Cons
The TradingView Essential Plan is a step up from the Free Plan, offering more flexibility, better customization, and expanded trading tools.
It provides more charts per tab, additional indicators, and access to historical data, making it a solid choice for traders who need deeper analysis.
It offers Supercharts with customizable indicators, multiple timeframes, and smart drawing tools, making it a great choice for technical analysis.
The stock, ETF, bond, and crypto screeners help users filter assets based on fundamental and technical criteria, while the heatmaps provide a quick visual of market trends.
However, there are still limitations. Real-time stock data requires an extra fee, portfolio management tools are missing, and fundamental data, ETF and fund research is limited.
- Charts per tab
- Indicators per chart
- Historical bars access
- Volume profile tool
- Custom timeframes
- Custom range bars
- Multiple watchlists
- Bar replay feature
- Indicators on indicators
- Stock & crypto screeners
- Technical alerts
- Pine Script® support
- More charts per tab
- Expanded indicators per chart
- Supercharts for technical analysis
- Multiple watchlists available
- Custom range bars support
- No real-time stock data
- Limited fundamental analysis tools
- No portfolio management features
- News updates not real-time
- Extra fees for data feeds
TradingView Essential Pricing vs Other Plans
TradingView Essential is the entry-level paid plan, offering more charting flexibility and real-time data compared to the free version while remaining more affordable than TradingView plus and Premium.
Plan | Monthly Subscription | Promotion |
|---|---|---|
Trading View Essential | $14.95
$108 ($9 / month) if paid annually | 30-day free trial |
Trading View Plus | $29.95
$180 ($14.95 / month) if paid annually
| 30-day free trial |
Trading View Premium | $59.95
$432 ($23.98 / month) if paid annually | 30-day free trial |
Trading View Expert | $119.95
$1,199 ($99.95 / month) if paid annually | N/A |
Trading View Ultimate | $239.95
$2,399 ($199.95 / month) if paid annually | N/A |
TradingView Plus provide more indicators per chart, additional alerts, and multiple chart layouts, making them better suited for active traders.
TradingView Premium, the top-tier plan, removes most restrictions, offering unlimited alerts, 25 indicators per chart, and advanced multi-screen support.
TradingView Essential: Mastering Charting & Analysis
TradingView’s essential plan provides traders with great tools for technical analysis. While they can be a little difficult for beginners, their value is superior:
-
Key Upgraded Features
The TradingView Essential Plan offers more credit use for TradingView top features:
Charts per Tab: Allows users to open multiple charts within a single tab, making it easier to compare different assets or timeframes without switching screens. This is essential for traders who track multiple markets at once.
Indicators per Chart: Expands the number of technical indicators that can be applied to a single chart, enabling deeper analysis and more complex strategies. This is crucial for traders who use multiple confirmations before making a trade.

- Historical Bars: Increases access to past price data, allowing traders to analyze longer-term trends and perform more effective backtesting. More historical bars provide a clearer picture of market cycles and past performance.
Price Alerts: Increases the number of active alerts that notify traders when an asset reaches a specific price, helping them react quickly to market changes. Essential for those who don’t monitor charts 24/7.
Technical Alerts: Triggers alerts based on technical indicator conditions like RSI overbought signals or moving average crossovers, automating trade monitoring. A must-have for traders who rely on technical setups.

- Parallel Chart Connections: Lets users sync multiple charts, making it easier to compare different assets, timeframes, or market conditions side by side. This is vital for traders using multi-timeframe analysis or correlating asset movements.
-
Additional Features
The TradingView Essential Plan also offers unique features that are not available with the free plan, most of them enhance technical analysis options and charging tools:
-
Volume Profile
Volume Profile helps traders analyze trading activity at different price levels, showing where most buy and sell orders are placed. This is useful for identifying support and resistance zones.
For example, if a stock consistently sees high volume around $50, it suggests strong interest at that price level.
A trader can use this to plan entry and exit points, buying near support and selling near resistance.
-
Custom Timeframes
With Custom Timeframes, users can create their own unique time intervals, rather than being limited to standard 1-minute, 5-minute, or daily charts.
This is perfect for traders who need precision timing for their strategies.
For instance, a scalper might want a 3-minute chart instead of a 5-minute one for faster signals, while a swing trader might prefer a 6-hour chart to better spot trend shifts.
-
Custom Range Bars
Custom Range Bars remove the element of time from charts and instead form new bars only when price moves a certain distance.
For example, instead of using a 5-minute chart, a trader can set a 10-pip range bar chart in forex trading, which means a new bar forms only when the price moves 10 pips.
This smooths out noise in low-volatility periods and helps traders spot clearer trends and breakout patterns without being distracted by time-based fluctuations.
-
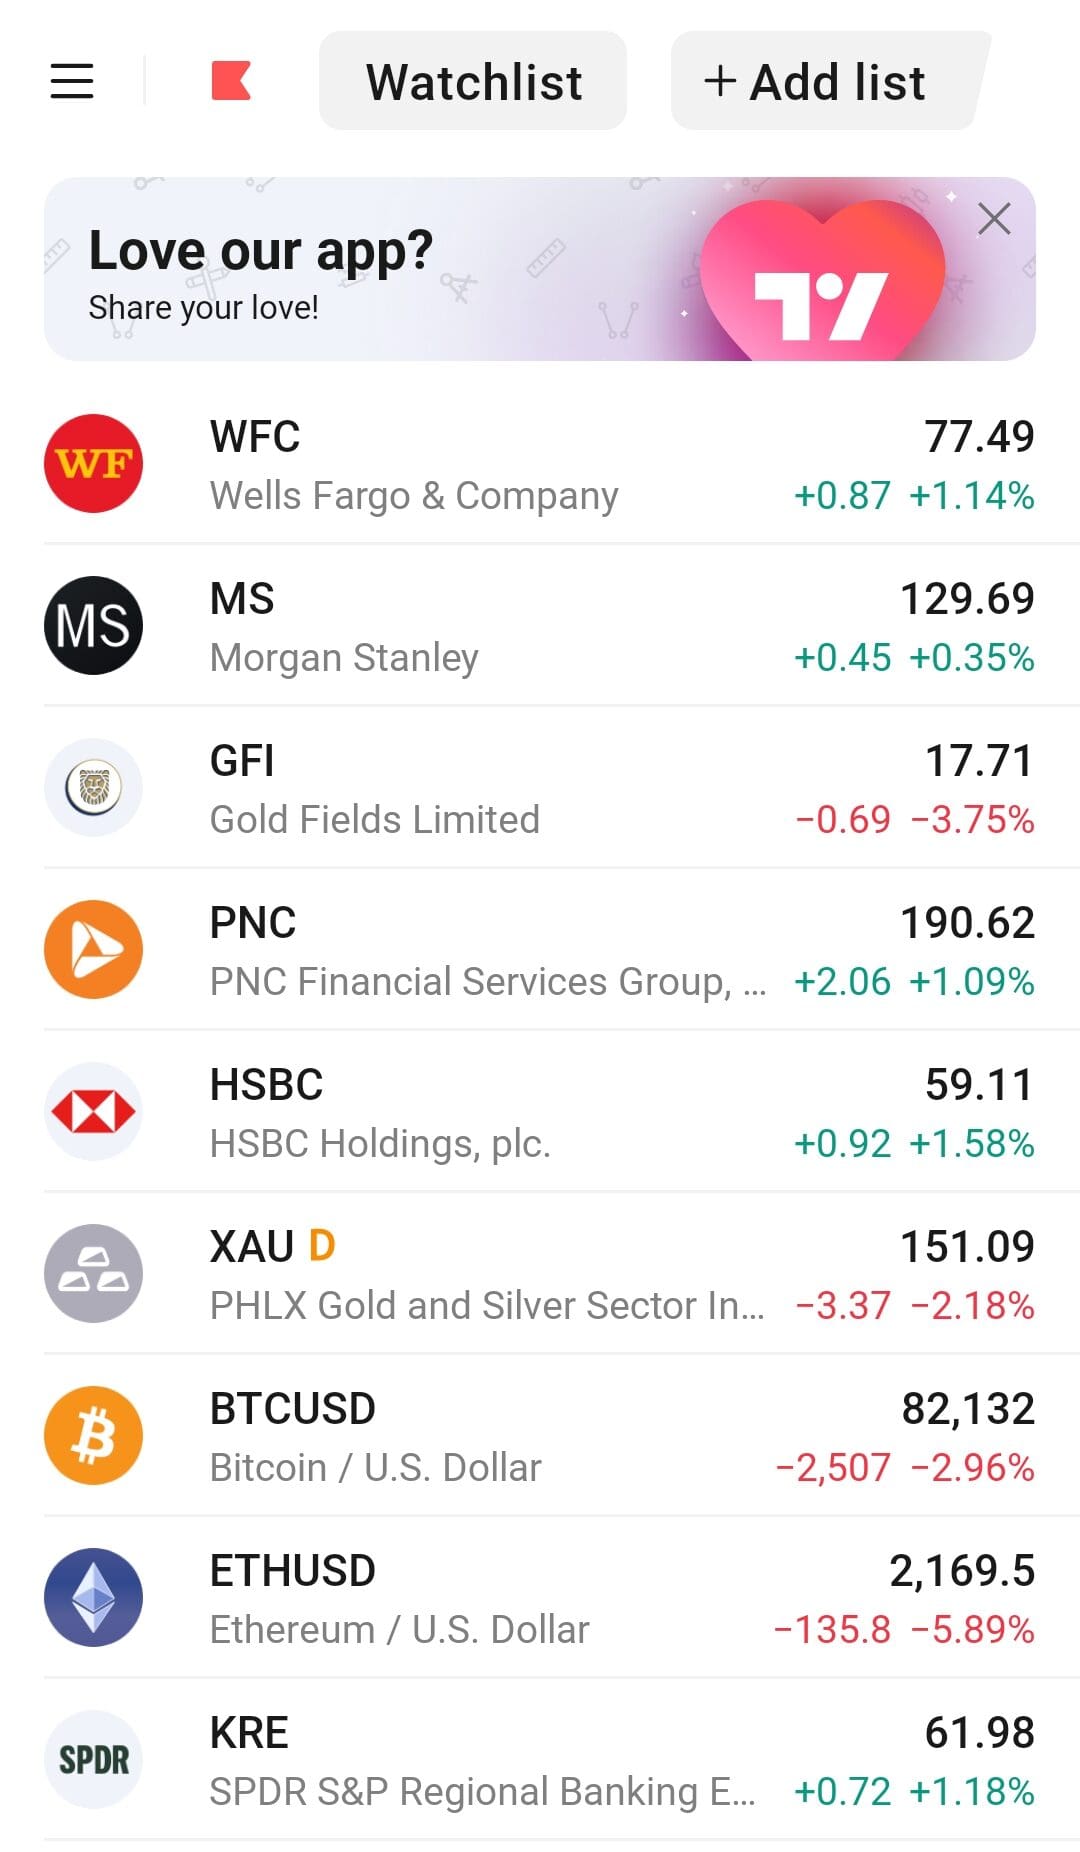
Multiple Watchlists
Unlike the free plan, which allows only one watchlist, the essential plan lets users create multiple watchlists for better organization. This is perfect for traders managing different asset classes.
For example, a trader can have separate watchlists for stocks, cryptocurrencies, and forex pairs, or even divide them into long-term investments vs. short-term trades.
-
Bar Replay
Bar Replay lets traders rewind the market and watch price movements unfold as if they were happening live. This is useful for practicing trading strategies and analyzing historical price action.
For example, a trader can select a past date, hide future price data, and test whether their trendline breakout strategy would have worked. They can step through each candle manually or let the replay run at different speeds.
Here's how it looks like:
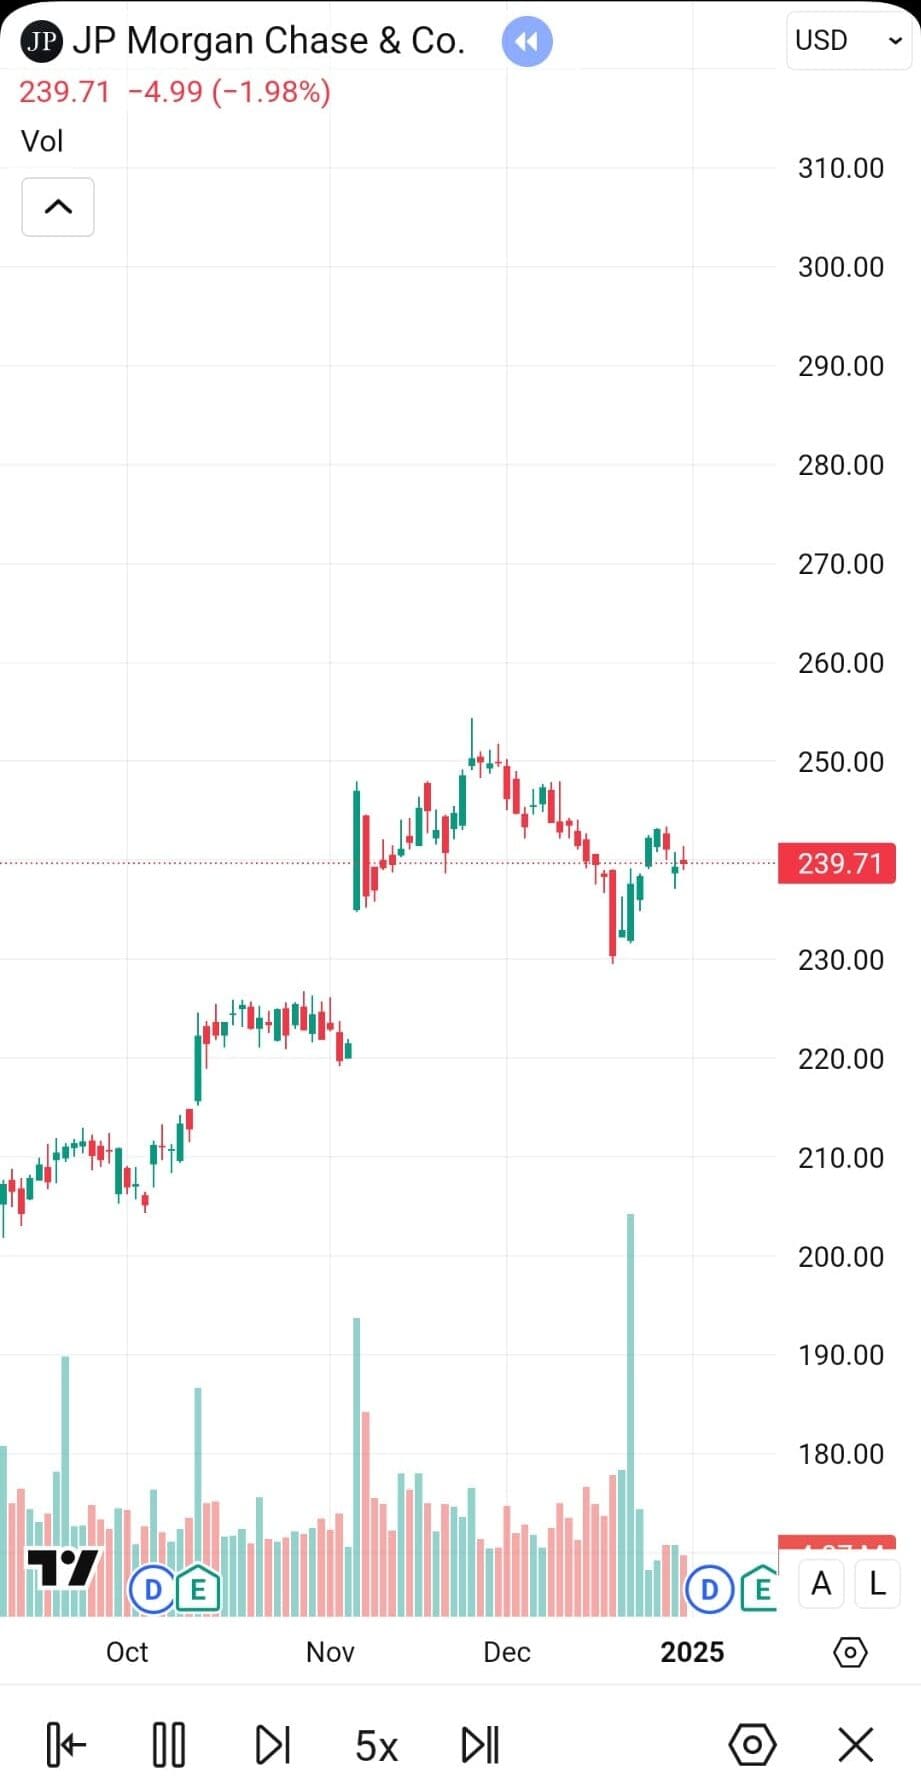
This feature is perfect for learning price action, testing strategies, and improving reaction times without the risk of live trading.
-
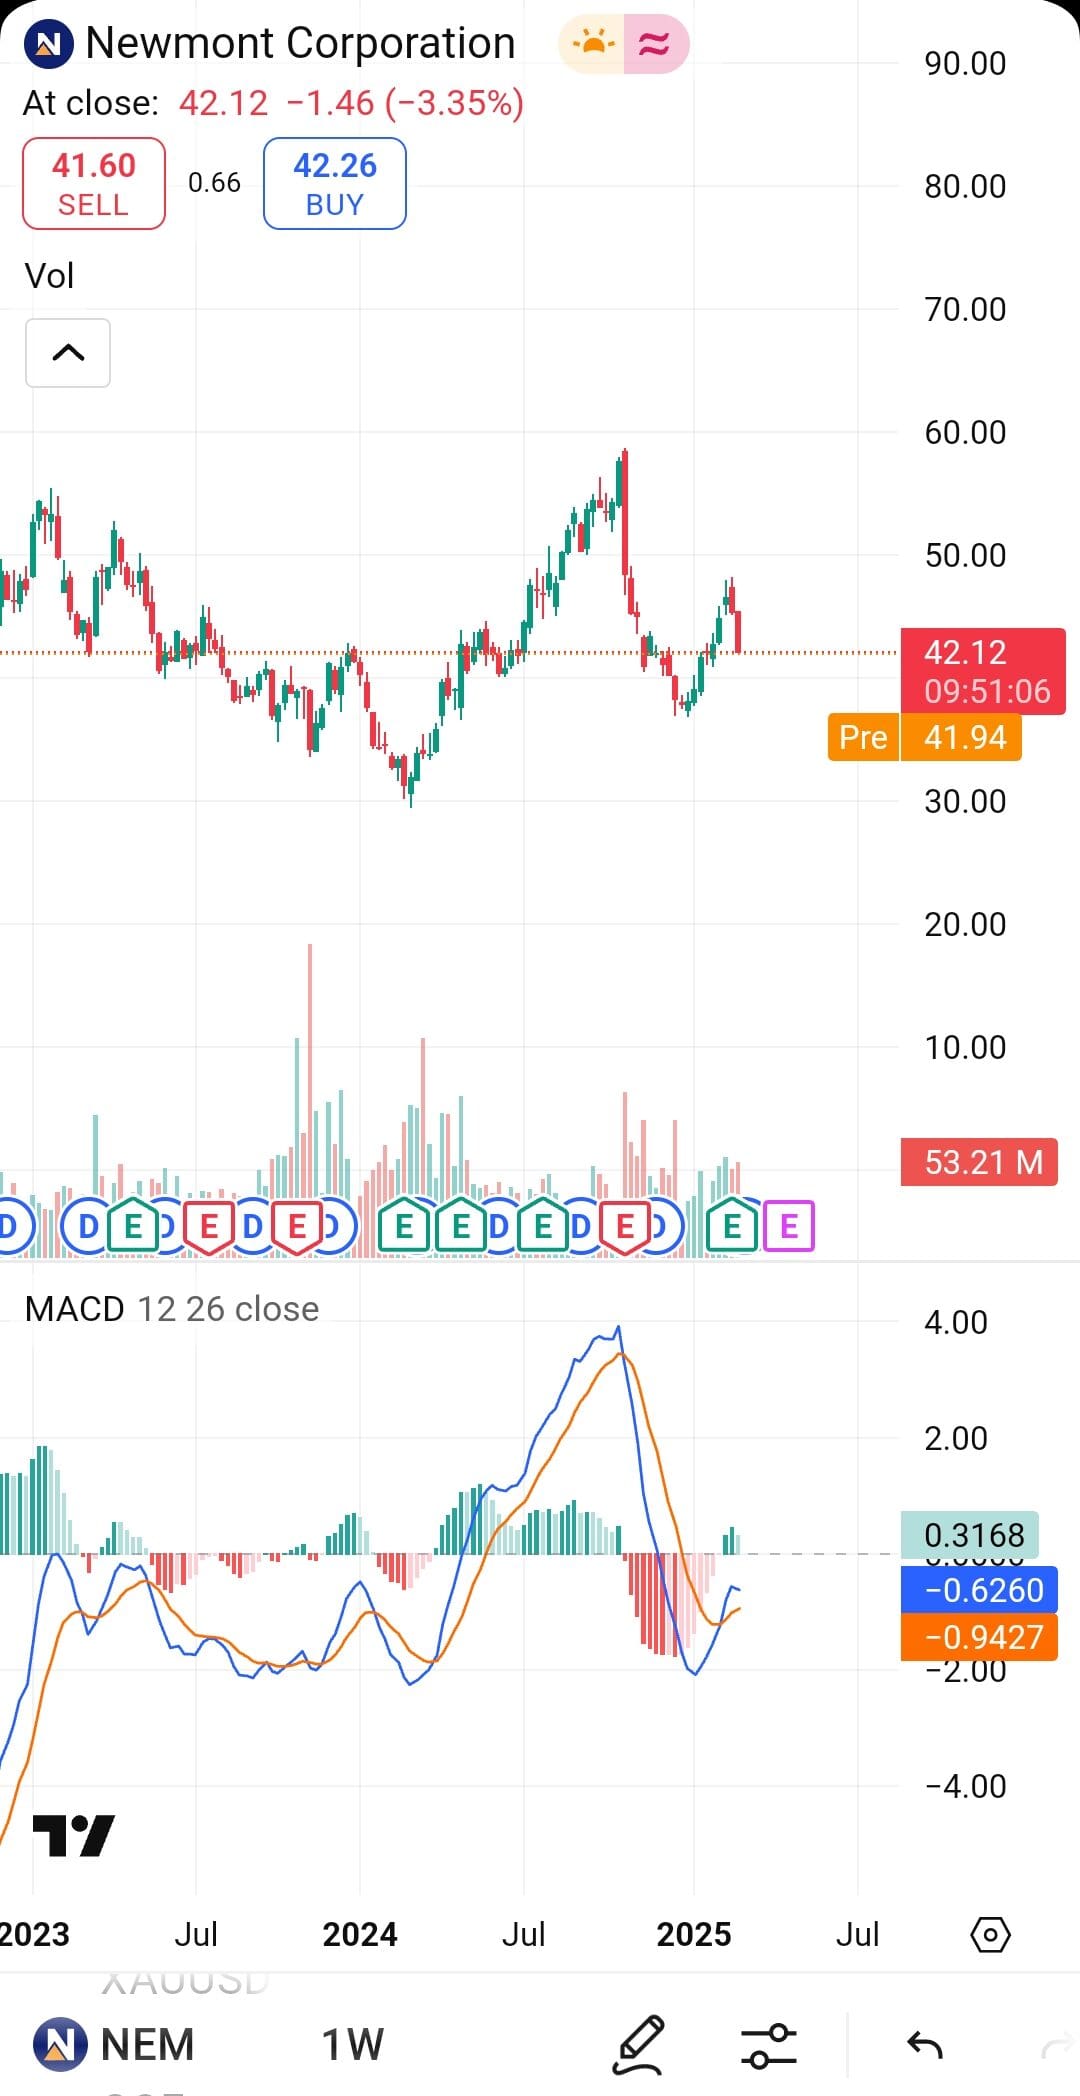
Indicators on Indicators
This feature allows traders to apply indicators to other indicators, adding more depth to technical analysis.
For example, instead of just using a moving average on price, a trader can apply a moving average on the RSI indicator to smooth out volatility and confirm trends.
Another use case is adding Bollinger Bands on volume to track periods of extreme buying or selling pressure.
This helps traders refine their signals and create more complex strategies, giving a deeper view of market conditions than basic indicator setups.
How To Analyze & Draw With TradingView Essential?
We reviewed TradingView’s supercharts, screeners and additional tools to see how it helps traders identify patterns and opportunities:
-
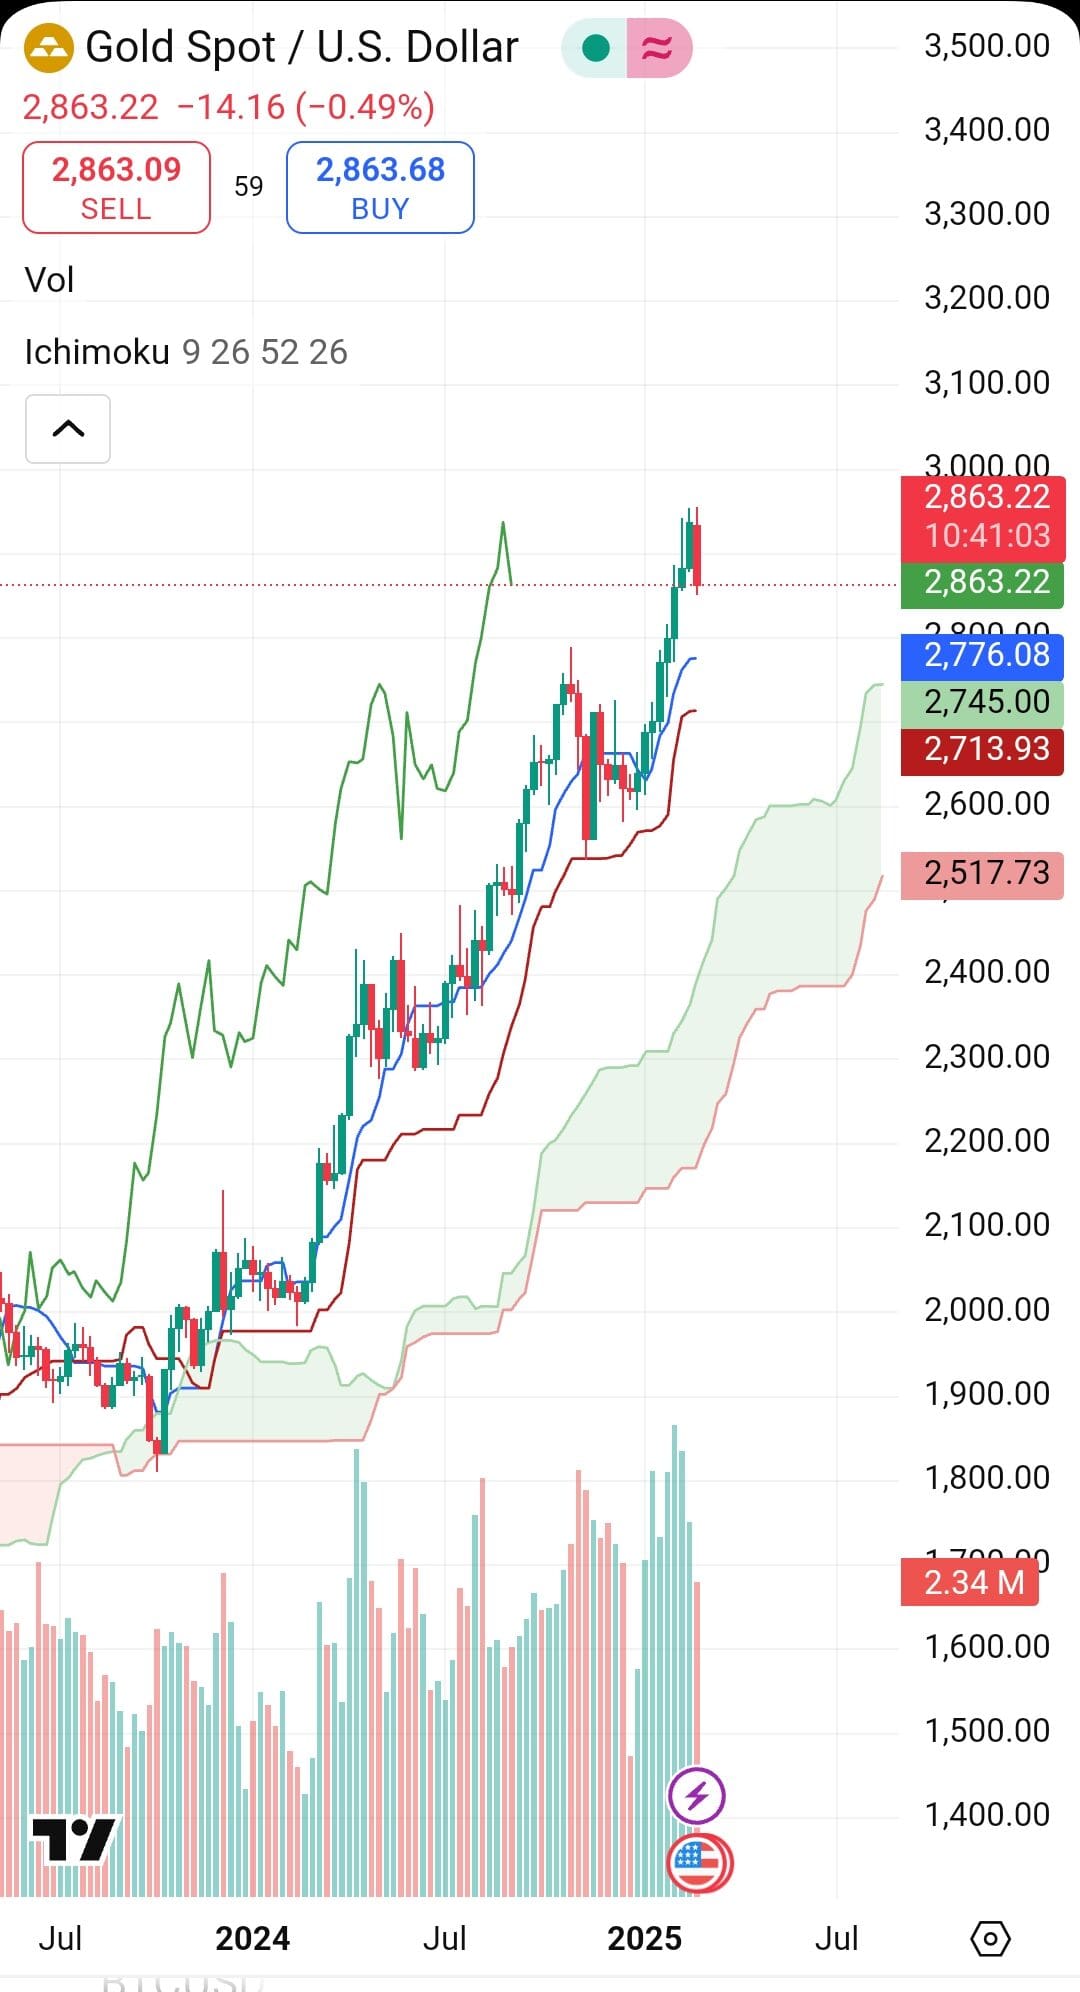
Supercharts: Advanced Stock Chart & Technical Analysis Tools
TradingView’s Supercharts offer a dynamic stock charting platform packed with technical indicators, stock analysis tools, and smart drawing features.
With over 400 built-in indicators, traders can analyze price trends, momentum shifts, and volatility patterns using popular tools like MACD, RSI, Bollinger Bands, and Moving Averages.

The multi-timeframe analysis feature allows traders to seamlessly switch between different time horizons, helping them spot long-term trends while tracking short-term market fluctuations.
Additionally, the 110+ smart drawing tools—including Fibonacci retracements, trendlines, and Gann fans—make it easier to map key support and resistance levels.
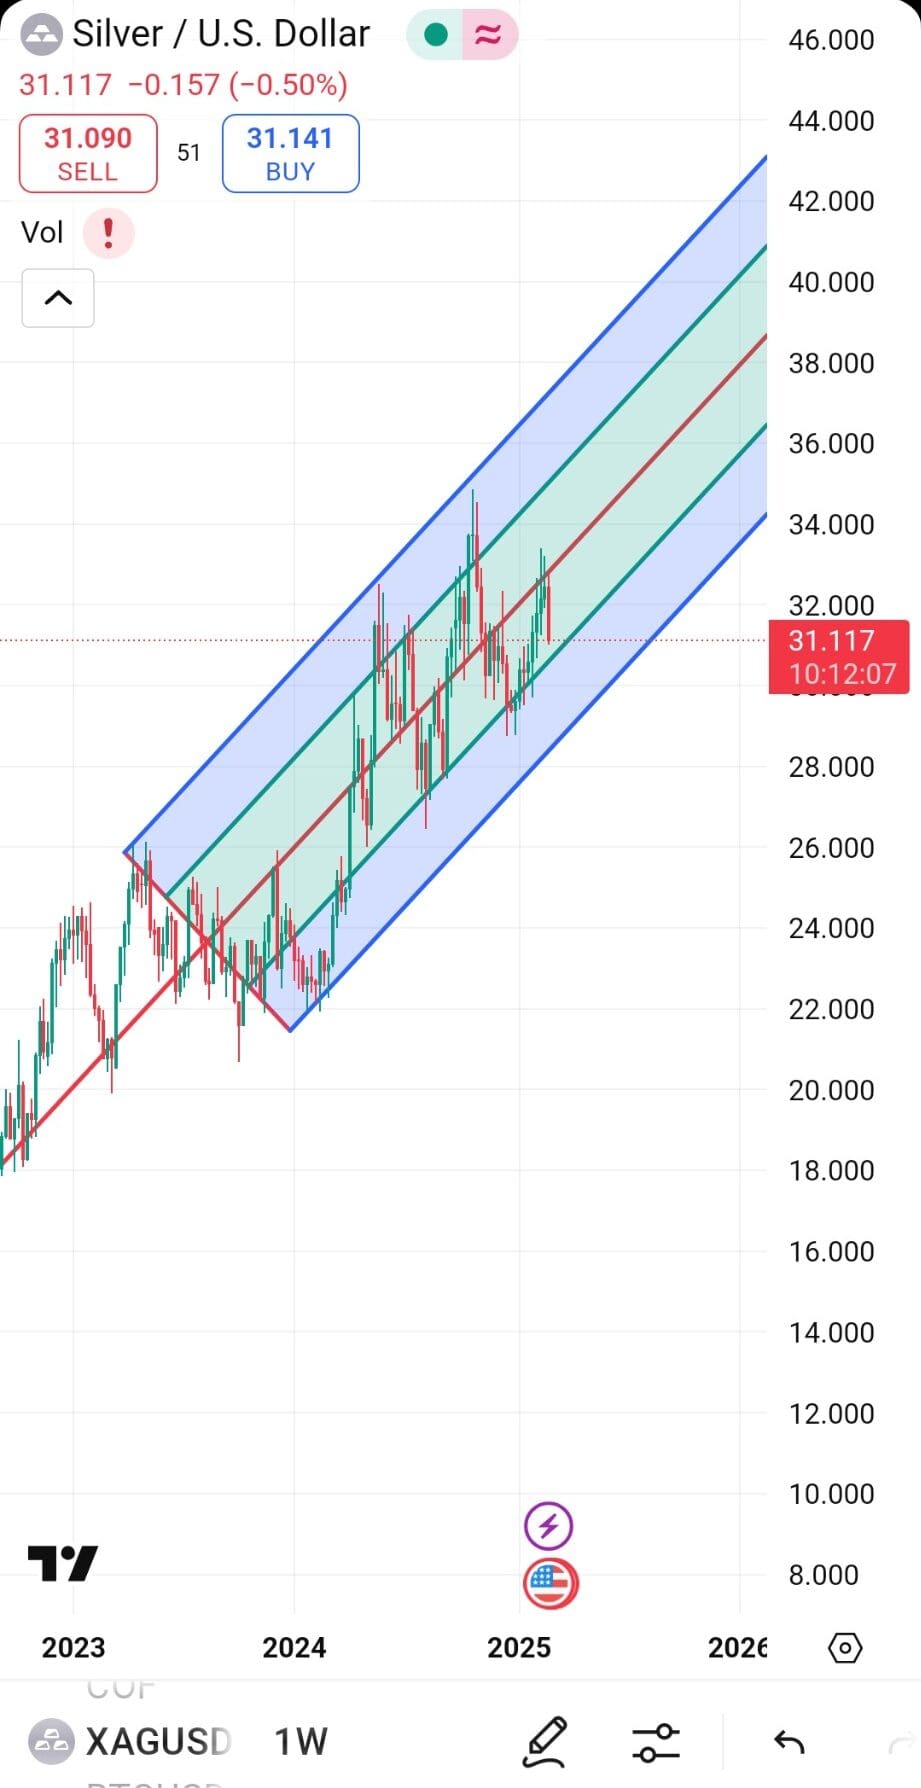
Unlike traditional charting software, Supercharts load quickly and are fully customizable, allowing users to adjust layouts, color schemes, and indicator settings effortlessly.
-
Stock, ETF, Bond & Crypto Screeners
TradingView’s Stock Screener is one of the leading advanced tools that helps traders filter and analyze stocks, ETFs, bonds, and cryptocurrencies using fundamental and technical metrics.
It enables users to sort stocks by market cap, sector, valuation, and analyst ratings, making it easier to identify investment opportunities.
- The Stock Screener includes key performance indicators such as beta, PEG ratio, and return on equity (ROE) to assess risk and profitability.
- The Bond Screener assists fixed-income investors in evaluating bonds based on issuer type, yield-to-maturity (YTM), and coupon rates
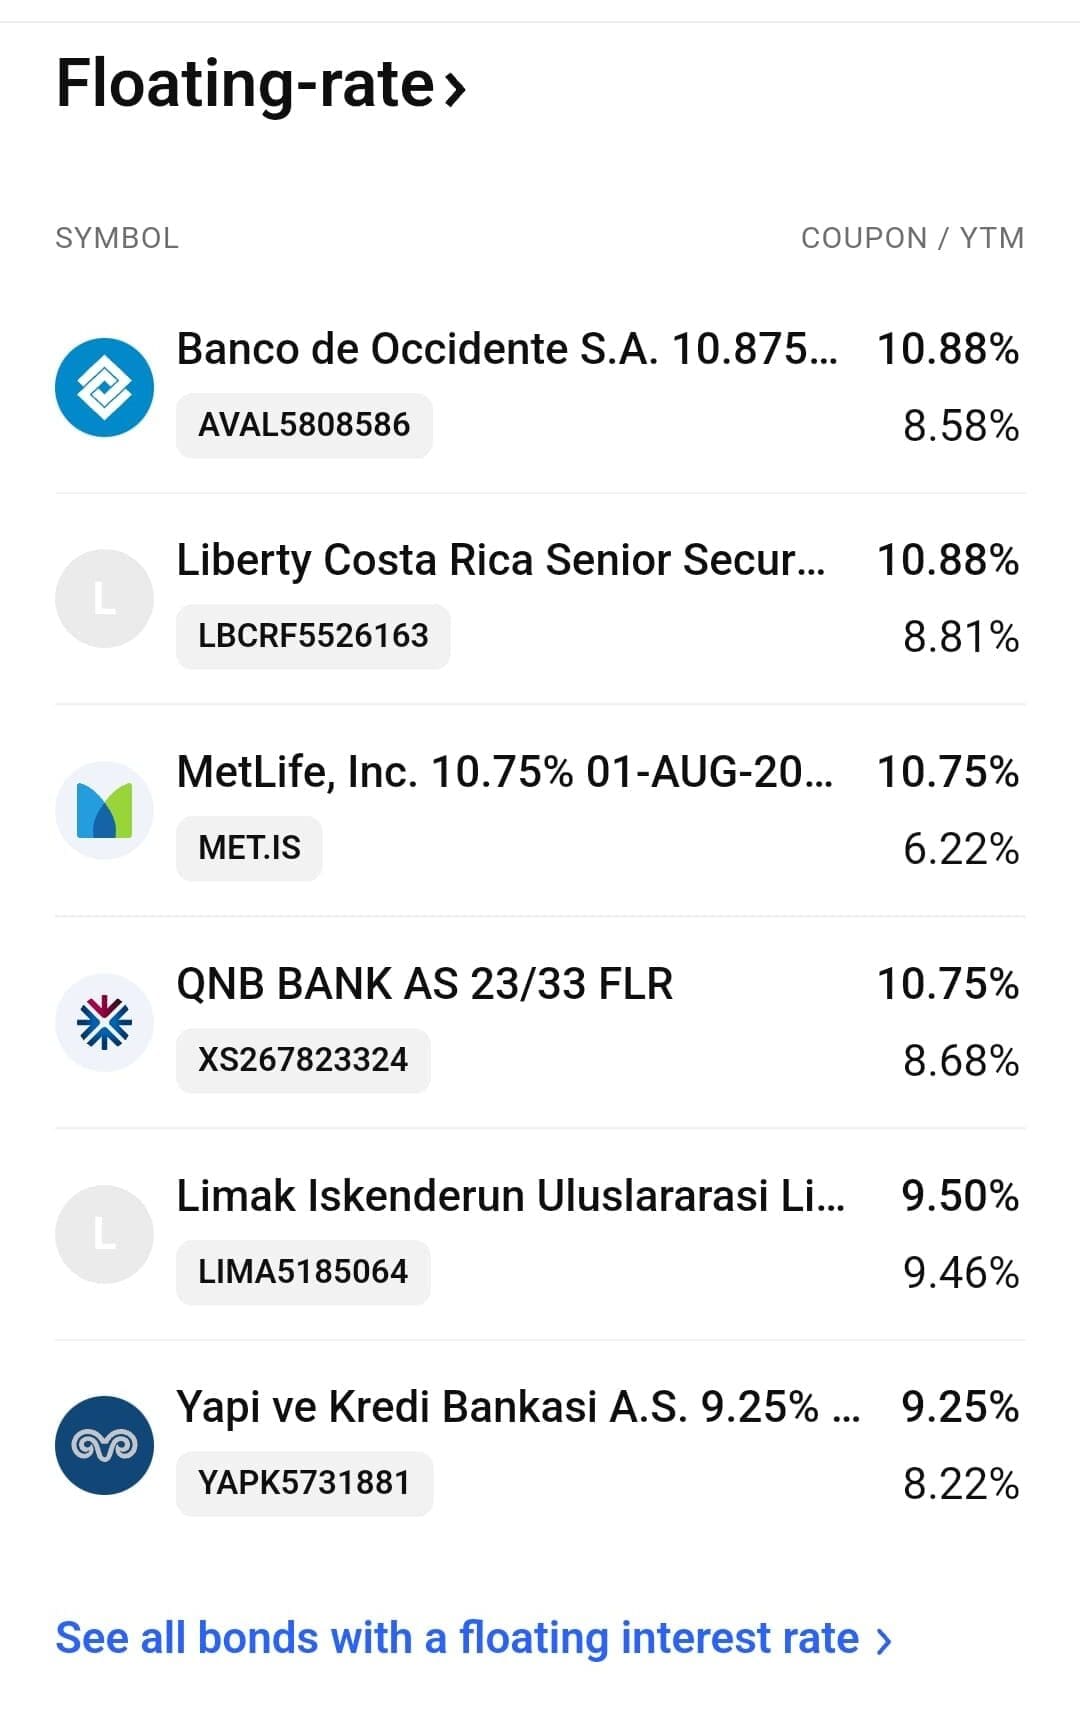
- The ETF Screener helps users find diversified investment options by filtering funds based on asset class, expense ratios, and sector focus.
- The Crypto Screener provides insights into market cap, trading volume, and liquidity metrics for digital assets.

-
Fundamental Analysis Tools: Stock Analysis & Financial Metrics
While TradingView is best known for technical analysis, it also offers a comprehensive suite of fundamental analysis tools to help investors evaluate stocks based on financial performance.
The Fundamentals Overview includes balance sheets, earnings reports, revenue growth trends, and dividend history, providing valuable insights into a company’s financial health.
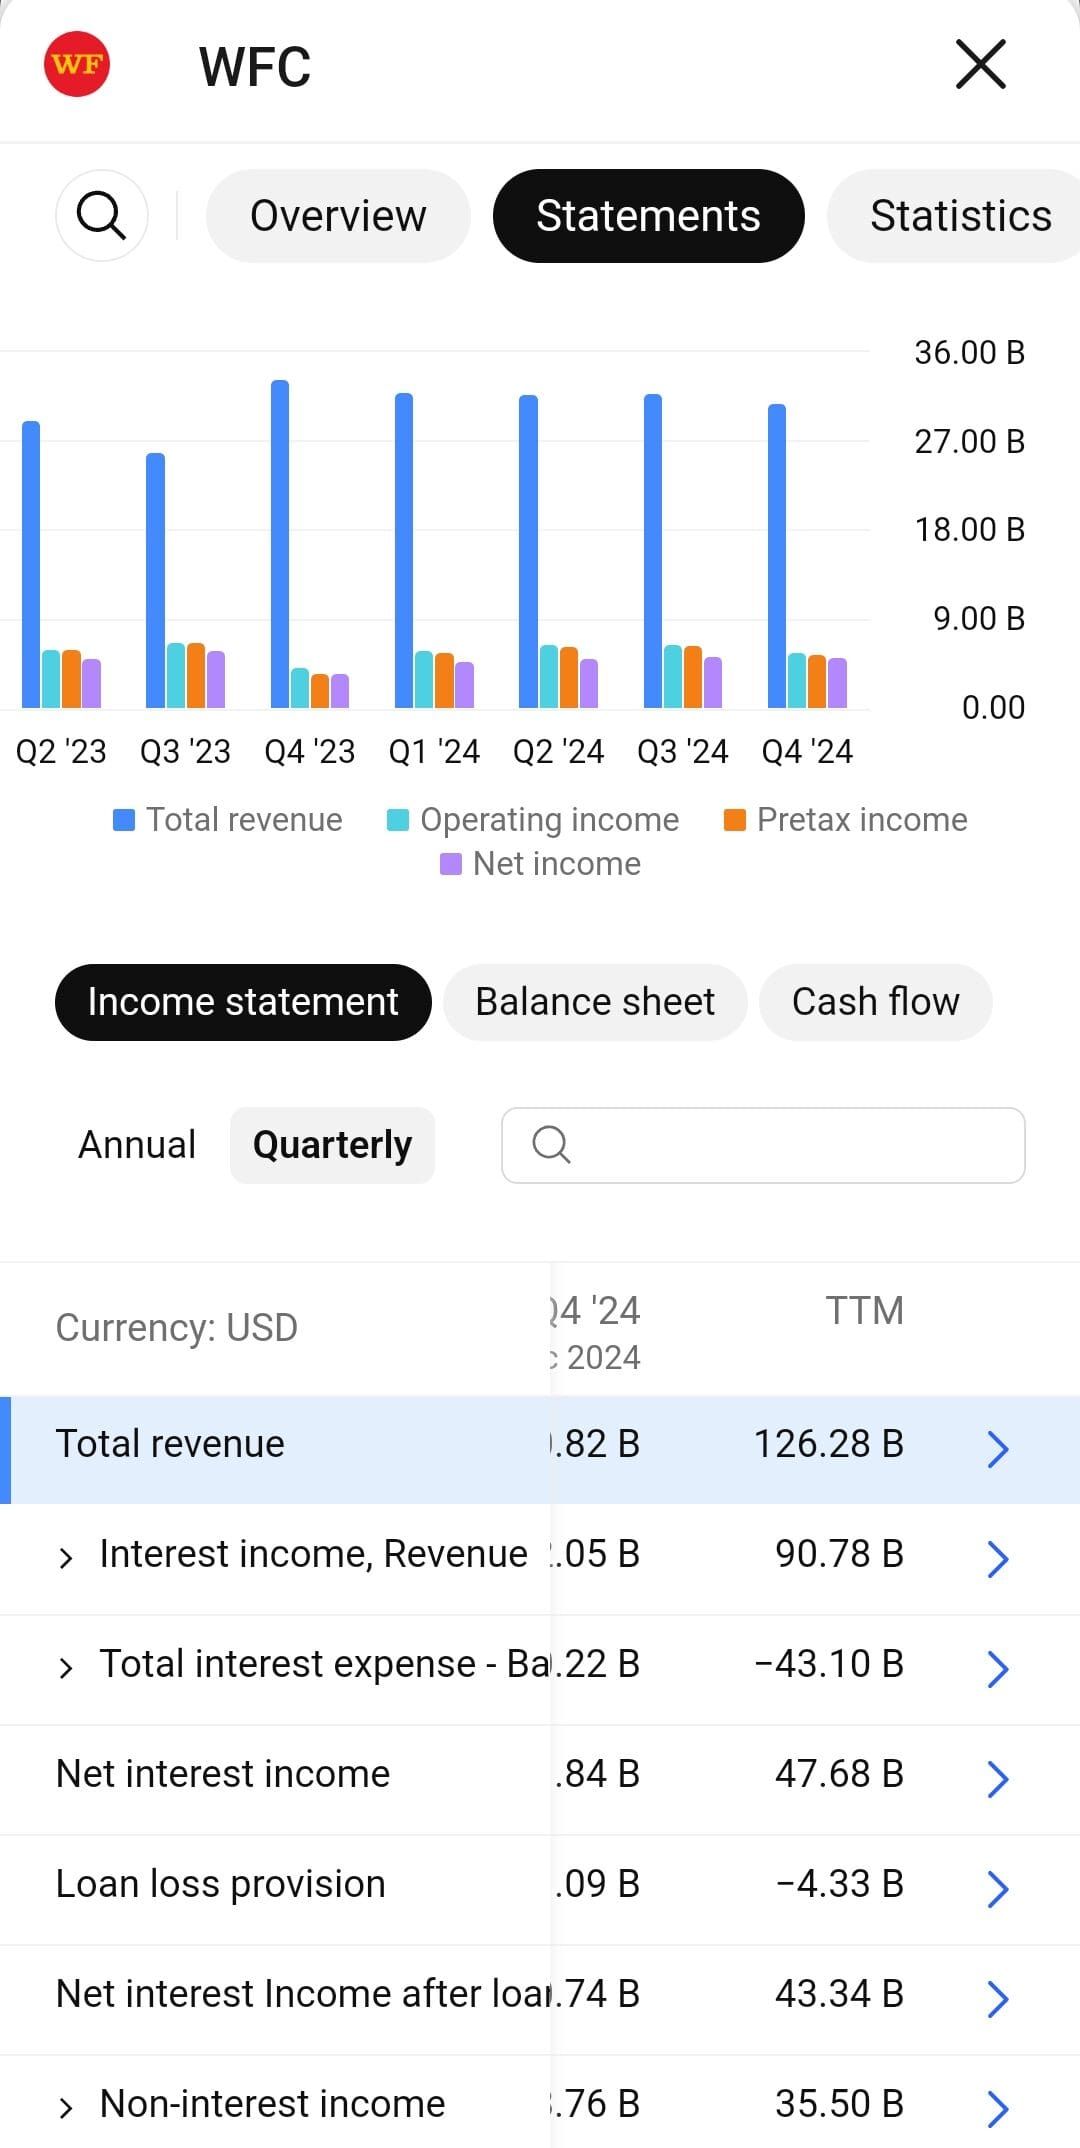
For news-driven traders, TradingView aggregates corporate earnings updates, insider trading activity, and ESG reports, though Free users may have restricted access to certain premium news sources.
Additionally, the Technical Analysis Summary combines popular indicators like moving averages, oscillators, and pivot points, generating quick, actionable insights.
-
Trading & Paper Trading
TradingView goes beyond charting by allowing users to trade directly from charts with integrated brokers.
The Paper Trading feature, available in the Essential plan, provides a realistic trading simulation using virtual money.
Traders can practice market, limit, stop, and stop-limit orders, refining strategies without financial risk:
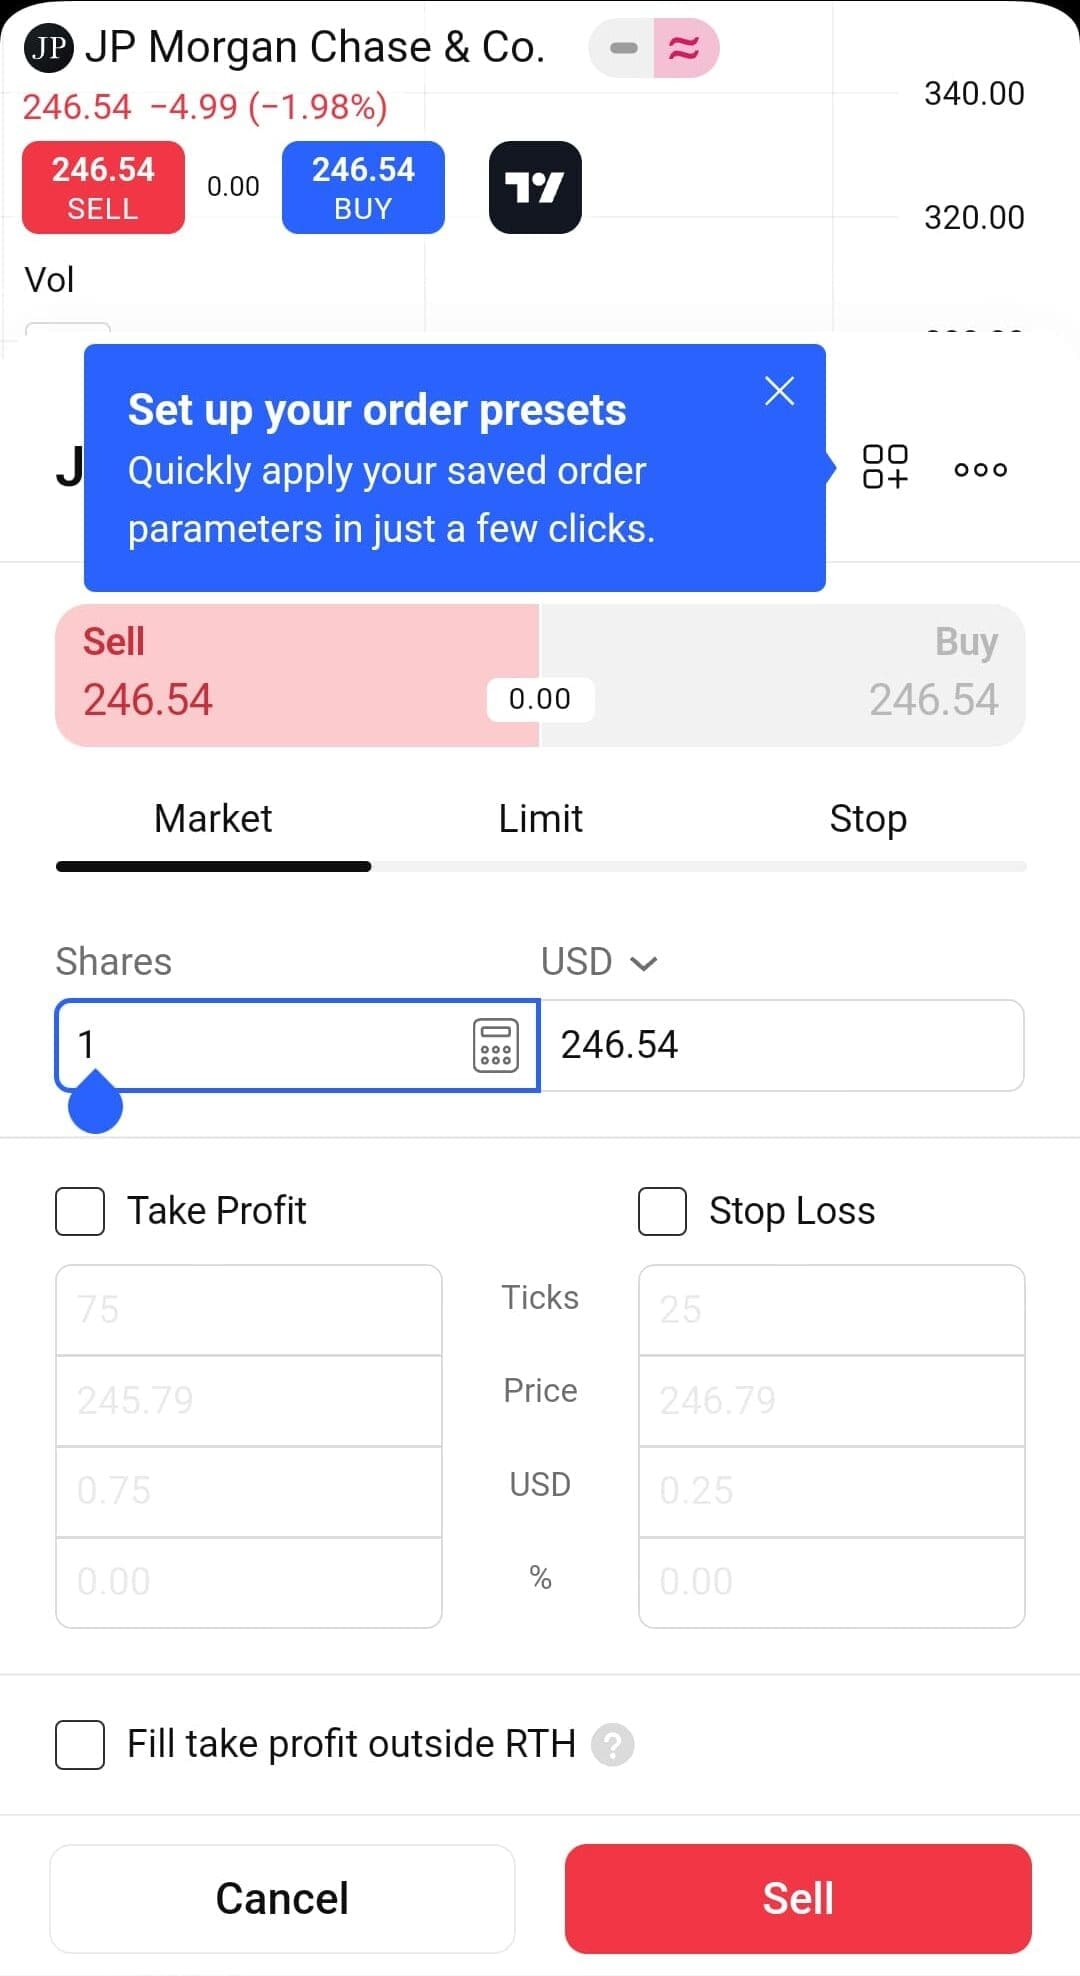
Order modifications are seamless, and performance tracking offers insights into profitability. This feature is ideal for new traders learning execution and experienced traders testing strategies.
However, live trading integration is limited to supported brokers, restricting direct execution options compared to standalone brokerage platforms.
-
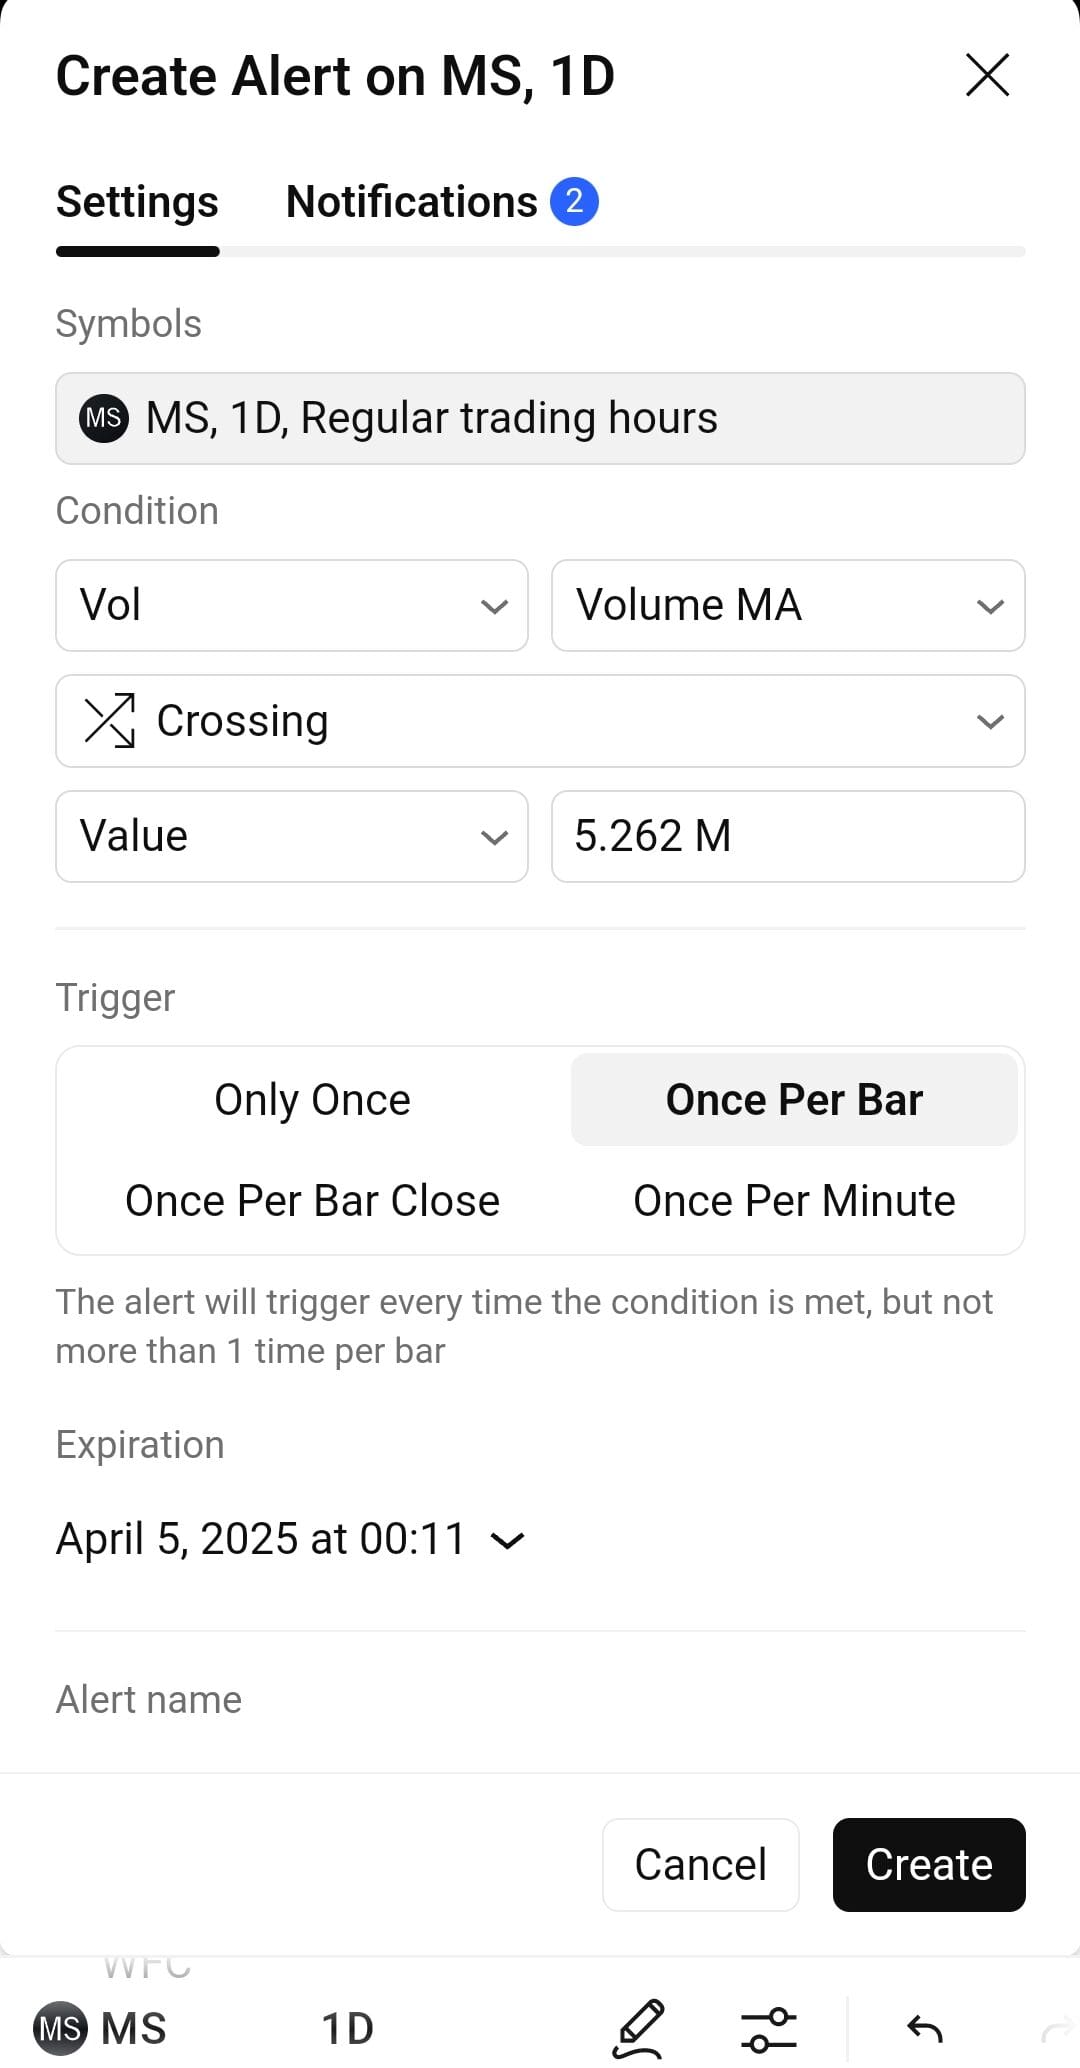
Up To 20 Price & Technical Alerts
TradingView’s trading alerts automate market monitoring by notifying users of key price movements and Essential users get up to 20 price alerts.
The system supports 13 alert conditions, including breakouts, RSI overbought signals, and moving average crossovers. See how many options you have:
Alerts run cloud-based, meaning they trigger even when the platform is offline. Notifications are sent via email, desktop pop-ups, and mobile push notifications, ensuring traders never miss an opportunity.
Premium users unlock hundreds of simultaneous alerts, making it an essential tool for news-based, swing, and breakout traders.
-
Pine Script® – Custom Indicators & Strategies
Pine Script® is TradingView’s proprietary coding language, designed for creating custom indicators, trading algorithms, and automated strategies.
Unlike complex programming languages, Pine Script® is lightweight and easy to use, allowing traders to build indicators with just a few lines of code.
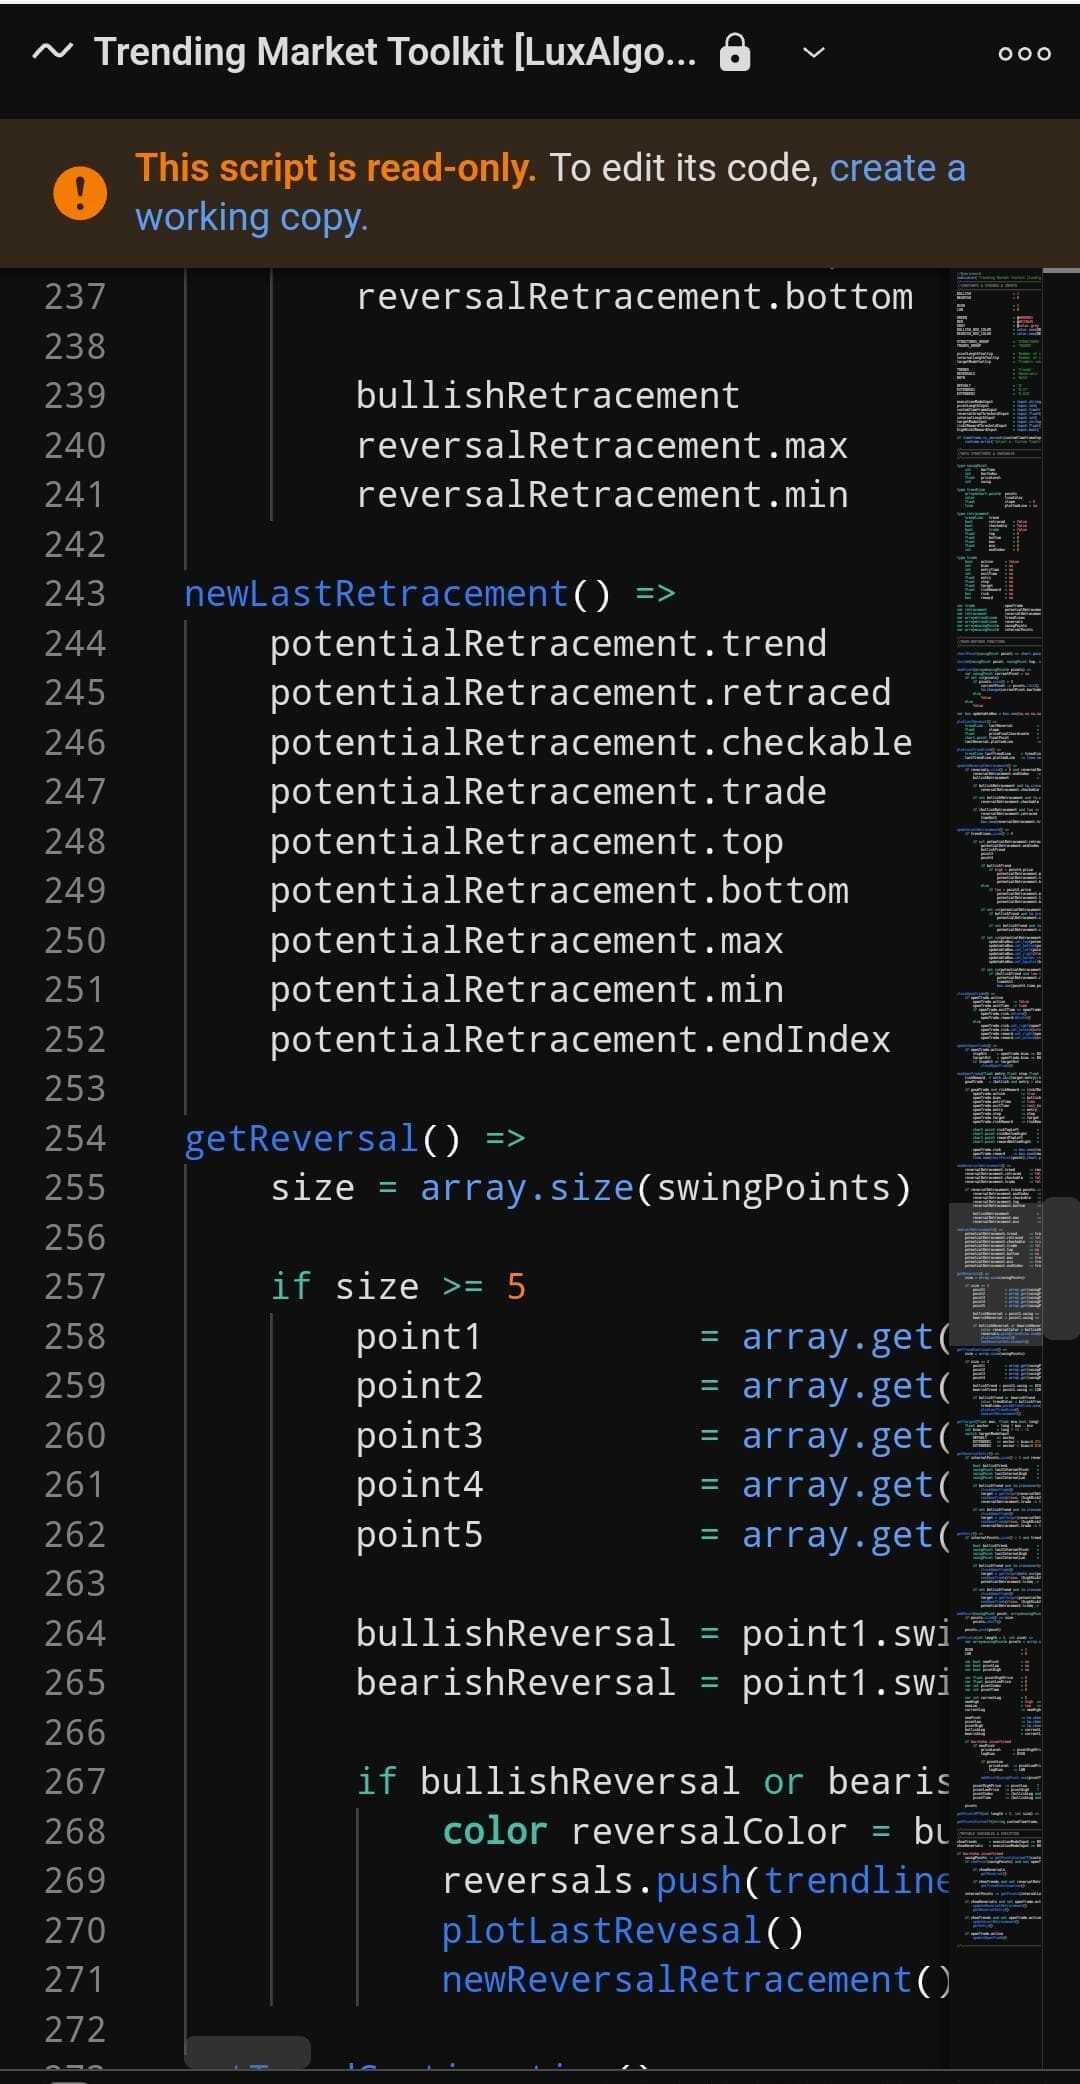
The platform features an integrated editor with debugging tools, making customization accessible.
Additionally, TradingView offers a public library with over 100,000 user-generated scripts, enabling traders to apply or modify existing strategies. This feature is ideal for quant traders,
-
Social Trading & Community
TradingView is not just a charting and analysis platform—it’s also a social trading network.
Users can publish trading ideas, share market analysis, and interact with other traders in real-time. The public scripts library provides access to 100,000+ custom Pine Script® indicators, allowing traders to use advanced charting tools without coding.
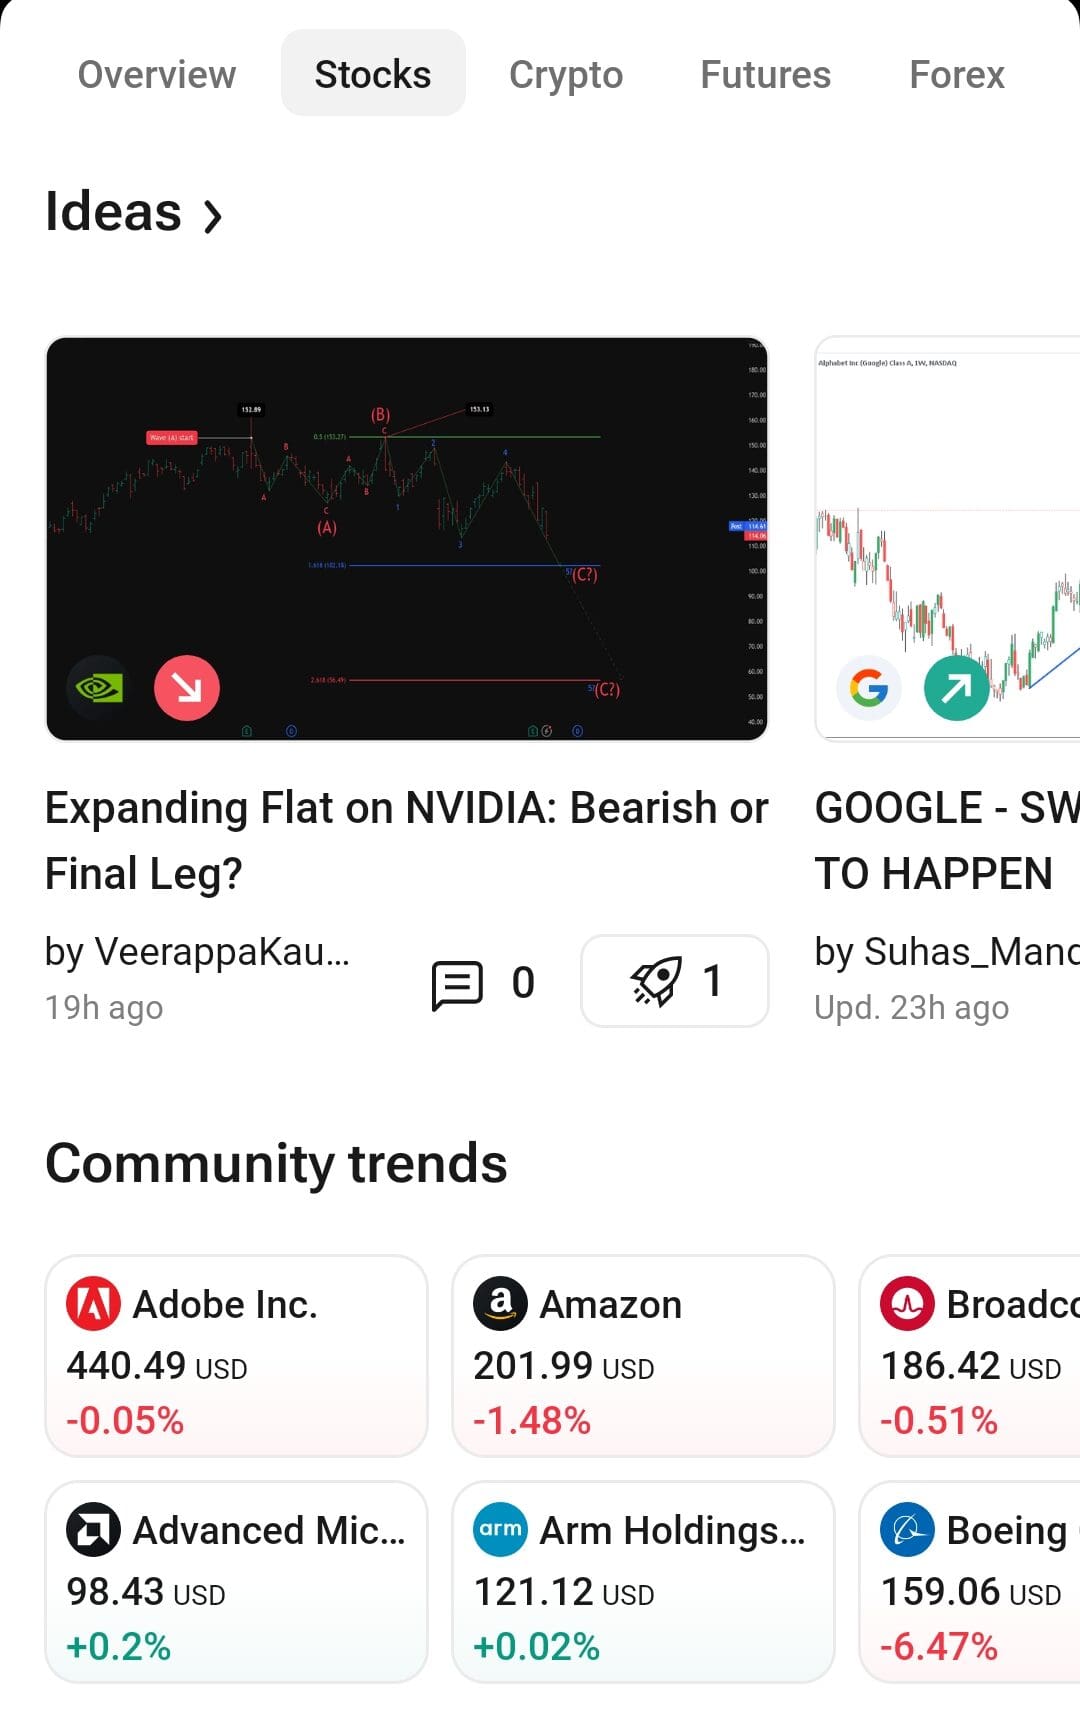
Community members post trade setups, educational content, and market forecasts, making it a valuable resource for learning technical and fundamental analysis.
This collaborative environment is ideal for beginner traders looking for insights and experienced traders seeking alternative perspectives on market movements.
Extra Features You Might Have Missed!
Here are additional features available in the Essential Plan:
- Ad-Free Experience: Removes all ads, offering a cleaner and distraction-free trading experience compared to the Free Plan.
- Indicator Templates: Enables users to save and reuse indicator setups, making it easier to apply preferred analysis settings across different charts.
- Pre-Market & After-Hours Data in Real Time: Offers instant access to extended trading session data for U.S. stocks, crucial for traders reacting to earnings reports and news events.
- Multiple Device Syncing: Ensures all saved charts, watchlists, and settings sync across devices, allowing seamless transitions between desktop and mobile.
- More Drawing Tools: Expands the available technical drawing tools, such as Gann tools, regression trends, and advanced Fibonacci levels.
- Custom Interval Alerts: Allows alerts to be triggered based on specific timeframes, such as weekly or monthly closing prices, for more flexible trade setups.
- Enhanced Screener Features: Provides more filtering options in the stock, ETF, forex, and crypto screeners, making it easier to find trade opportunities.
- Auto Chart Scaling: Adjusts chart size automatically to fit price movements, ensuring clear visibility of patterns and key levels.
- Cross-Asset Comparison: Enables overlaying different asset classes (e.g., stocks vs. commodities, forex vs. crypto) to analyze correlations and market relationships.
TradingView Essential Plan vs. Competitors: Worth the Price?
The TradingView Essential Plan competes with entry-level plans from platforms like Yahoo Finance Bronze, Stock Analysis Pro, InvestingPro, StockCharts, and Benzinga Pro.
Compared to Yahoo Finance Bronze, TradingView offers superior real-time charts and technical indicators, while Yahoo is better for fundamental research and stock fair value estimates.
Plan | Subscription | Promotion |
|---|---|---|
Yahoo Finance Silver | $24.95
$239.40 ($19.95 / month) if paid annually | N/A |
TradingView Plus | $29.95
$180 ($14.95 / month) if paid annually
| 30-day free trial |
Zacks Premium | $249 ($20.75/month)
No monthly plan | 30-day free trial |
MarketBeat All Access | $39.99
$399 ($33.25 / month) if paid annually | $199/year or $19.99/month
30-day free trial + $19.99/month for the first year (billed monthly) OR $199/year ($16.58/month). New members only. |
InvestingPro | $15.99
$120 ($9.99 / month)
if paid annually | N/A |
TipRanks Premium | $359 ($30 / month)
No monthly plan | 30 day money-back guarantee |
Finviz Elite | $39.50
$299.5 ($24.96 / month) if paid annually | 30-day money-back guarantee |
Seeking Alpha Premium | $299 ($24.90 / month)
No monthly subscription | $4.95 for 1 month |
StockCharts provides a similar charting experience but lacks TradingView’s social trading features and Pine Script customization. Benzinga Pro’s entry-level plan is news-focused, making it better for event-driven traders.
InvestingPro and Stock Analysis Pro emphasize financial data over technical tools, making TradingView Essential the best choice for technical traders.
Limitations: Where Does TradingView Essential Fall Short?
While the Essential Plan is a solid upgrade from the Free Plan, it still has some noticeable limitations that might not work for active traders, day traders, or investors:
-
Stock Ratings & Fundamental Analysis Are Basic
The Essential Plan doesn’t provide advanced stock ratings, deep valuation metrics, or detailed industry comparisons.
Fundamental investors who need tools like fair value analysis, insider trading data, and advanced earnings breakdowns won’t find them here.
Competitors like Yahoo Finance Gold, Zacks, and Morningstar Investor offer better stock ratings, deeper financial research, and proprietary analysis, making them a stronger choice for long-term investors.
-
Still No Real-Time Stock Data Without Extra Fees
Even though the Essential Plan provides faster data updates, real-time stock data is not included by default. If you’re trading stocks, you’ll need to pay extra for exchange-specific data feeds.
Without real-time updates, traders relying on quick price movements could struggle with delayed execution and outdated information, making it harder to react to fast market changes.
-
No Real-Time Breaking News
Essential Plan users don’t get real-time financial news updates, which can be a huge disadvantage for momentum traders and fundamental investors.
Unlike platforms that integrate live feeds from Benzinga, CNBC, Bloomberg, or Dow Jones, TradingView only provides basic news updates. This can lead to traders reacting too late to market-moving events.
-
Lack of Portfolio Management Tools
One major drawback of the TradingView Essential Plan is the lack of portfolio management tools.
While the platform excels in charting and market analysis, it doesn’t provide built-in portfolio tracking, performance analysis, rebalancing suggestions, or personalized portfolio recommendation features.
Which Traders Benefit Most from TradingView?
The TradingView Essential Plan is an excellent choice for traders and investors who need more tools than the Free Plan but don’t require pro-level features.
Here are types of users who may benefit the most:
Technical Analysis Investors: Expands charting tools, provides volume profile and indicators on indicators, making it great for investors who rely on technical signals for long-term positions.
Beginners Looking to Learn: A balanced mix of powerful tools, easy-to-use charts, and a strong trading community makes it a great stepping stone for new traders.
Swing Traders: Offers multiple charts per tab, more indicators per chart, and custom timeframes, making it easier to track medium-term trends.
Crypto Traders: Provides real-time crypto data, price alerts, and volume profile tools, helping traders analyze market movements more effectively.
Why Fundamental Investors May Not Like It?
The TradingView Essential Plan offers more features than the Free Plan, but it still has limitations that may not suit certain traders and investors:
- Investors Want Stock recommendations: investors who want to see recommendations, ranking of stocks, or stock picks will prefer other platforms.
- Long Term Investors: Those who rely on fundamental analysis and must dig deeper into ETF and mutual funds research will find TradingView Essential Plan a bit limited.
- News-Based Traders: Doesn’t provide real-time financial news from sources like Benzinga or CNBC, making it difficult to react quickly to market-moving events.
- Multi-Asset Portfolio Managers: Offers only basic ETF and fund research, missing deeper analysis tools for diversified investment tracking.
FAQ
No, the Essential Plan does not allow data exporting (e.g., CSV files for trading history or stock screeners). This feature is only available in higher-tier plans.
No, Level 2 market depth data is not included. You need to purchase real-time market depth access separately or upgrade to a higher-tier plan.
No, futures data is delayed unless you purchase real-time exchange feeds separately.
No, TradingView is a web-based platform and requires an internet connection to access its charts and tools.
No, the TradingView watermark remains visible on exported charts unless you upgrade to Premium.
No, while it offers an economic calendar, real-time breaking news (like CNBC, Benzinga, or Bloomberg feeds) is not included.
Review Premium Stock Analysis & Charting Tools


How We Rated Premium Investing Analysis & Research Tools
At The Smart Investor, we evaluated premium investment research platforms based on their advanced features, data depth, and overall value compared to other paid alternatives. Each platform was rated based on the following key aspects:
- Advanced Fundamental Analysis Tools (20%): We assessed the depth of financial data, historical reports, earnings forecasts, and valuation models. Platforms that provided institutional-grade insights, DCF analysis, customizable financial models, and access to premium analyst reports scored higher.
- Advanced Technical Analysis Features (20%): We reviewed the availability of real-time charting, advanced indicators, custom scripting, and AI-driven pattern recognition. Platforms that offered backtesting tools, automated trading strategies, and integration with third-party software received better ratings.
- Stock Screener & Premium Filters (15%): A high-quality screener is essential for pro investors, so we evaluated customization depth, real-time filtering, and AI-driven stock discovery. Platforms offering pre-built expert screeners, backtesting capabilities, and sector-specific analytics scored the highest.
- Portfolio Tracking & Advanced Alerts (10%): We rated platforms on their ability to provide real-time performance tracking, portfolio rebalancing tools, and tax optimization insights. Platforms with smart alerts, AI-driven risk assessments, and brokerage integration ranked higher.
- Ease of Use & Customization (15%): We assessed how well premium platforms balance advanced capabilities with user-friendly interfaces. Those offering custom dashboards, API access, and seamless multi-device usability received better ratings.
- Pricing (20%): We considered how the plan's pricing compared to other premium plans and what benefits traders/investors get. Is it worth it overall?
